
From the 1University of Groningen, Department of Clinical and Developmental Neuropsychology, Groningen and 2Royal Dutch Visio, Centre of Expertise for blind and partially sighted people, Rehabilitation & Advice, Haren, The Netherlands
Objective: To investigate practical fitness to drive mobility scooters, comparing visually impaired participants with healthy controls.
Design: Between-subjects design.
Subjects: Forty-six visually impaired (13 with very low visual acuity, 10 with low visual acuity, 11 with peripheral field defects, 12 with multiple visual impairment) and 35 normal-sighted controls.
Methods: Participants completed a practical mobility scooter test-drive, which was recorded on video. Two independent occupational therapists specialized in orientation and mobility evaluated the videos systematically.
Results: Approximately 90% of the visually impaired participants passed the driving test. On average, participants with visual impairments performed worse than normal-sighted controls, but were judged sufficiently safe. In particular, difficulties were observed in participants with peripheral visual field defects and those with a combination of low visual acuity and visual field defects.
Conclusion: People with visual impairment are, in practice, fit to drive mobility scooters; thus visual impairment on its own should not be viewed as a determinant of safety to drive mobility scooters. However, special attention should be paid to individuals with visual field defects with or without a combined low visual acuity. The use of an individual practical fitness-to-drive test is advised.
Key words: low vision; traffic safety; quality of life; orientation and mobility; rehabilitation; motorized scooters; practical fitness to drive.
Accepted Nov 23, 2016: Epub ahead of print Feb 16, 2017
J Rehabil Med 2017; 49: xx–xx
Correspondence address: Christina Cordes, University of Groningen, Department of Clinical and Developmental Neuropsychology, The Netherlands. E-mail: c.cordes@rug.nl
Maintaining a high quality of life and facilitating participation in everyday activities are important goals of visual rehabilitation. One essential aspect of this is supporting independent mobility, the importance of which has been demonstrated in several studies (1–3). To enable people with motor problems to maintain an independent life, mobility aids, such as mobility scooters, can be used. However, with increasing age, not only the occurrence of motor impairments, but also the development of visual disorders arises (4), which in turn can influence an individual’s fitness-to-drive (the physical and mental functions that are needed to participate safely in traffic) (5). Supporting independent mobility in a safe manner is therefore an important challenge in individuals with visual impairment.
Two types of visual impairment, low visual acuity (blurry vision) and visual field defects (impaired peripheral vision), can impact on traffic safety in different ways. Research on fast traffic (cars) has shown that low visual acuity can hamper the ability to see road signs and read street names (6, 7), whereas visual field defects can lead to poorer hazard detection, gap judgement, or lane positioning (8, 9). To maximize traffic safety, visual standards have been established for people using cars and other fast vehicles. However, in the Netherlands, there are no visual standards for driving mobility scooters. The number of traffic accidents involving mobility scooters is increasing (10), but it is not clear whether visual impairment plays a role in these accidents. Therefore, there is uncertainty among users and professionals about visually impaired people’s fitness to drive mobility scooters. This can either lead to an unsafe use of mobility scooters or to undue reluctance to use or suggest using these vehicles.
In the Netherlands, driving eligibility of visually impaired individuals is determined on an individual basis by specialists working in (visual) rehabilitation. Ideally, this assessment seeks to maximize both the independent mobility and the safety of an individual. Finding this balance, however, is a challenge, since several factors contribute to driving safety. Apart from (visual) fitness-to-drive, driving ability (the extent to which the driving task has been learned), driving behaviour (how the individual chooses to behave in traffic), compensation strategies, personality traits, or environmental factors are just some of the determinants of safe traffic behaviour. It is unclear to what extent visual impairment influences mobility scooter driving safety, as research is lacking in this field.
Only a few studies have explored visual fitness-to-drive regarding driving performance in mobility scooters. Massengale et al. (11) showed that visual perception and a number of lower-order visual functions were related to power wheelchair driving performance. However, since the driving test was mostly structured with several controlled elements, it is difficult to draw conclusions about the participants’ driving safety in dynamic traffic situations. Nitz (12) included an on-road test in her study, but could not find any direct relationship between visual acuity and driving performance in mobility scooters. A ceiling effect might have played a role, since visual acuity was rather high and varied little between participants. In general, both studies tested participants without specific visual impairments, making it difficult to determine the impact of different kinds of visual impairment on driving performance on mobility scooters.
The aim of the current study was to compare the performance of visually impaired participants with normal-sighted controls on a practical fitness-to-drive test. In contrast to medical fitness-to-drive, practical fitness-to-drive explores the ability to drive safely with an impairment, taking into account individual strategies. Therefore, this study not only considers the limitations of visual impairment, but also the abilities of visually impaired individuals.
The present study is part of the larger project Mobility4all, conducted at the University of Groningen, which explores different aspects of driving safety of visually impaired individuals in slow motorized vehicles. This study focussed specifically on practical fitness-to-drive; other aspects will be reported elsewhere. The research took place at the University Medical Centre in Groningen, the Netherlands (UMCG).
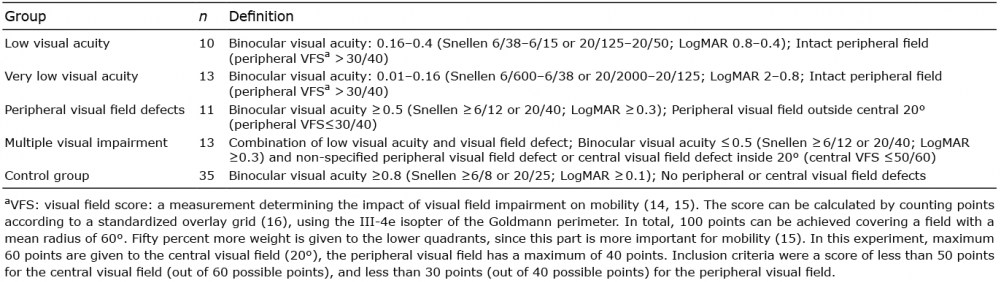
A total of 101 visually impaired and normal-sighted participants took part in the experiment, of whom 81 (46 visually impaired, 35 controls) were analysed in the present study after exclusion of participants due to unclear group membership or missing data. Visually impaired participants were categorized based on their visual acuity and visual field at the time of the assessment (Tables I and SI) into 4 subgroups: low visual acuity, very low visual acuity, peripheral field defects, and a group with multiple visual impairments.
Table I. Specification of the visual characteristics per group
Normal-sighted controls and visually impaired participants showed no differences in age, level of education (13), and general cognitive functioning (Table II). Visually impaired participants had less driving experience with motorized vehicles than normal-sighted controls.
Table II. Participants’ characteristics
For the recruitment of participants, rehabilitation centre newsletters, patient organizations, and local newspapers were used. Inclusion criteria were age between 50 and 75 years and fitting into the categories as described in Table I. Participants were excluded when they reported neurological disorders (i.e. brain damage, dementia), psychiatric disorders that influenced traffic participation, motor problems that hindered the operation of a mobility scooter (e.g. tremor), severe hearing problems or deafness, alcohol and drug addiction, or oculomotor problems. All but one participant were novice mobility scooter users. The experiment was approved by the Ethical Committee Psychology of the University of Groningen, the Netherlands, according to the Declaration of Helsinki. All participants provided written informed consent.
Visual acuity, visual field, and contrast sensitivity were assessed binocularly with the participants’ usual correction at 500 lux on the day of the experiment. The Early Treatment Diabetic Retinopathy Study (ETDRS) 2000 letter chart (17) was used to measure visual acuity. The visual field was determined with the III-4e-isopter of the Goldmann perimeter and contrast sensitivity was measured with the Gecko contrast sensitivity test (18). An independent orthoptist converted the visual field into a visual field score (VFS, Table I).
To administer the driving test, the Excel Excite 3 Galaxy mobility scooter (Van Os Medical B.V., Steenbergen, The Netherlands) was used. This mobility scooter has 3 wheels and a maximum speed of 15 km/h. It is operated by pulling/pushing a finger-controlled lever, with which both accelerating and decelerating are regulated. The scooter slows down and stops when the lever is released; it is not equipped with an active braking system. The speed can further be adjusted using the so-called “turtle-button” (for low maximum speeds up to 6 km/h required for use on the pavement) and/or by turning a knob on the dashboard.
Prior to the driving test, all participants received a detailed explanation on the operation of the mobility scooter and completed a short driving skills test. The 30-min driving test exposed participants to real-world situations. It started inside the UMCG and continued outside on the pavement at low speeds, with increasing exposure to more challenging situations. In the final part, participants were asked to drive a short distance on a cycle lane and a road with maximum speed of 15 km/h (Table SII). The test leader gave instructions, and a research assistant observed the drive. Both were informed of the participants’ visual condition. To limit the risks to the participants, the mobility scooter was equipped with a remotely controlled stop switch. The criteria for stopping were based on the judgement of the test leader who activated the switch whenever participants lost control of the scooter and there was a risk of falling or collision. After feedback was provided to the participants the drive continued.
The mobility scooter was equipped with a GPS camera (Contour LLC, Lehi, Utah, USA) (Contour +2 Action) mounted on a pole on the back of the scooter, giving a view of the participant’s head and the visual scene ahead. The video recording was rated independently by 2 experienced occupational therapists specialized in orientation and mobility in visual rehabilitation, who were blind to the medical condition of the participants. Both of them were trained in how to rate the mobility scooter drives. An online observation form was created in which they rated 12 different subscales and general safety (Table III) on analogue continuous scales ranging from 0 to 10. Rating of the scales is based on the 10-point Dutch grading system. Performance below a score of 5 was evaluated as insufficient. The evaluation form was based partly on the Test Ride for Investigating Practical fitness-to-drive (TRIP), a Dutch assessment to evaluate car driving performance in people with impairments, and on the expertise of independent mobility specialists working in driving safety research or in visual rehabilitation (19). The subscales comprised specific situations and general behaviours or skills that were seen as essential for participating safely in traffic (Table III). General safety was formed by the occupational therapists’ overall impression of the participants’ driving performance. Evaluation on this scale determined whether participants failed or passed the driving test. In addition, the number of critical events was recorded. Critical events were defined as situations in which the test leader decided to press the remote control in order to stop the mobility scooter, and as situations the specialists rated as potentially unsafe based on the video recording.
Table III. Subscales evaluated by the occupational therapists specialised in orientation and mobility
Statistical Package for the Social Sciences (SPSS Inc., Chicago, IL, USA; version 22) was used for data analysis. Inter-rater reliability was good for the total score “general safety” (ICC=0.622). On the specific subscales, inter-rater reliability ranked from low to good (ICC range = 0.260–0.655). The ratings of the 2 specialists were combined by adopting the lowest score for each participant respectively. Thus, a conservative approach was adopted, ensuring a high standard of safety. The score of 5 served as a cut-off value according to the Dutch school grading system. Ratings below 5 were considered insufficient, whereas ratings equal to or above 5 represented a sufficient performance. For the total score “general safety”, this meant that ratings below 5 indicated failing the driving test. Both the actual score on the scales and the number of people with a sufficient or insufficient rating were analysed. The rating on the scales and the number of critical events of the visually impaired participants were compared with the normal-sighted controls. Since the assumptions for parametric tests were not met, Kruskal–Wallis tests were executed to investigate differences between groups. The significance level was set at α=0.05. Simple contrasts were used as a post-hoc analysis, using the Mann–Whitney U test, comparing normal-sighted controls with each group of the visually impaired participants. A Bonferroni correction was applied (α = 0.013).
One participant with very low visual acuity, 2 with visual field defects, and 2 with multiple visual impairments failed the driving test (Table IV). None of the participants with low visual acuity and normal-sighted controls failed the driving test. A Kruskal–Wallis test revealed significant differences between all 5 groups (H (4) = 23.7, p < 0.001; Table V). The general safety of normal-sighted participants (median 8.1) were rated significantly higher compared with participants with low visual acuity (median 7.6, U = 77.5, p = 0.007, r = 0.89), those with very low visual acuity (median 7.0, U = 117.0, p = 0.010, r = 0.65), peripheral field defects (median 6.5, U = 63.5, p = 0.001, r = 1.16), and multiple visual impairment (median 7.1, U = 61.0, p < 0.001, r = 1.89).
Table IV. Number and type of insufficient subscales of the participants who failed the driving test
There were no significant differences between the 4 groups with visual impairment (H (3) = 3.46, p = 0.325).
Within the group of normal-sighted controls, 4 people were rated below cut-off on the subscales “street crossing without zebra”, “keeping distance”, “timing” and “confidence”. Visually impaired participants showed a range of insufficient ratings, depending on the subscale assessed (Fig. 1). On the subscale “lateral position” no-one was evaluated as insufficient, whereas the subscales “head movement” and “confidence” showed the most insufficient ratings. Normal-sighted controls and participants with low visual acuity had the fewest insufficient ratings on the different subscales. The group with multiple visual impairment showed the highest number of insufficient ratings, followed by participants with peripheral visual field defects and those with very low visual acuity. A Kruskal–Wallis test showed significant differences between all 5 groups on all subscales except for “zebra crossing” and “defensive driving” (Table V). A post-hoc analysis, in which the 4 groups with visual impairment were individually compared with normal-sighted controls on the different subscales, showed that all visually impaired individuals scored significantly worse on “keeping distance” compared with normal-sighted controls. Participants with visual field defects differ on more subscales from normal-sighted controls compared with the other groups of participants with visual impairment. The 4 groups with visual impairment did not differ significantly from each other (all p > 0.10).
Fig. 1. Number of visually impaired participants with an insufficient rating on general safety and the different subscales.
Visually impaired individuals as a group differed significantly in their number of critical events compared with normal-sighted controls (U = 461.6, p < 0.001, α =0.05). No differences could be found between the 4 groups of participants with visual impairment (H (3) = 1.24, p =0.743, α =0.05). Comparison of all 5 groups revealed a significant difference (H (4) = 13.5, p =0.009, α =0.05). Participants with very low visual acuity (U =11.0, p =0.003, α =0.013) and multiple visual impairments (U =107.5, p =0.005, α =0.013) had significantly more critical events than normal-sighted controls (Fig. 2). There were no differences between participants with low visual acuity and normal-sighted controls (U = 122.0, p = 0.094, α = 0.013) and participants with visual field defects and normal-sighted controls (U = 120.0, p = 0.033, α = 0.013).
Fig. 2. Boxplots of the number of critical events of the different groups of participants. *Outliers are larger than 1.5 × interquartile range.
The aim of the present study was to assess practical fitness-to-drive in visually impaired individuals. In general, visually impaired individuals were found to be able to drive mobility scooters safely, even though they were rated as less safe than normal-sighted controls at a group level. Visual field defects or multiple visual impairments appear to affect driving safety the most, whereas participants with low visual acuity (0.16 ≤ visual acuity ≤ 0.4, intact visual field) performed as well as normal-sighted controls. Very low visual acuity (0.01 ≤ visual acuity < 0.16, intact visual field) appears to be problematic only in individual cases. These observations support the notion that impaired visual fields have a greater detrimental impact on driving safety than does low visual acuity (6). Nevertheless, since over 80% of participants with peripheral visual field defects (with or without low visual acuity) passed the driving test, an assessor should not assume that individuals with visual field defects cannot drive safely. This is in line with a study by de Haan et al. (19), who showed that more than half of the participants with homonymous hemianopia were evaluated as fit to drive a passenger car in an on-road test. Furthermore, Coeckelbergh et al. (20) showed that training could improve practical fitness-to-drive in people with visual field defects. One participant (visual acuity ≈0.03, VFS < 12) was not able to continue with the mobility scooter driving test after training. Due to the participant’s visual impairment, he was dependent on a human guide when walking and, unlike the other participants, he was not able to learn to drive the scooter safely (i.e. unable to drive straight ahead, constantly bumping into walls). Not being able to master the basic manoeuvring techniques (driving ability) in mobility scooters after sufficient training is certainly a reason to advise against using mobility scooters. At the same time, the fact that all other participants were able to acquire sufficient driving ability shows how important it is to assess people with visual impairment practically, instead of basing a decision about eligibility for mobility scooter driving on clinical factors, e.g. solely on type and severity of visual impairment. Exploration of the subscales showed that some behaviours appeared to be more important than others in predicting general safety. Sufficient head movements and confidence, for example, appeared to be difficult for participants who failed the driving test. Moreover, all participants who were rated as insufficient when driving in the cycle lane failed the driving test. In the Netherlands, cycle paths are often used by mobility scooters, which could have been the reason for the stronger weight given to this element. However, people who are not or do not feel safe in the cycle lane could still be safe driving with lower speeds on the pavement. It would be valuable to investigate whether driving in the cycle lanes at higher speed leads to more accidents than driving on the pavement. In addition, all groups with visual impairment appeared to maintain less distance from other traffic participants or objects compared with normal-sighted controls. These results indicate that visually impaired people should receive additional training on specific behaviours compared with normal-sighted people. Yet, future research needs to investigate the role of speed and should explore the relative importance of different elements of a scooter driving test in more detail.
An individual practical fitness-to-drive test is a needed to determine mobility scooter driving eligibility, since driving safety is not determined solely by visual impairment. As with driving a car, driving a mobility scooter is a complex task, and driving safety therefore depends on multiple factors. Brouwer et al. (21) proposed a rehabilitation-oriented approach, focusing on training drivers to compensate for shortcomings rather than introducing medical standards for driving. According to Michon’s model (22), the driving task can be divided into 3 levels: the strategic level (i.e. planning the drive), tactical level (i.e. distance to other road users), and operational level (i.e. steering). Brouwer et al. (21) claimed that compensation is most efficient on the strategic or tactical level as time pressure is low. On the operational level, time pressure is high and compensation is more difficult. Teaching visually impaired mobility scooter users how to look appropriately, given their impairment, in order to avoid complex situations, or to adjust their travel speed in a timely way could therefore be important means to make driving mobility scooters safe.
To the best of our knowledge this is the first study to investigate fitness-to-drive a mobility scooter in a practical driving test in individuals with visual impairment. Using a population of visually impaired participants increases the validity of the outcomes and provides more insight about the capabilities of visually impaired individuals. By dividing our participants into different groups dependent on their visual impairment we were able to show that the abilities of people with visual impairments cannot be generalized. However, a number of limitations have to be discussed.
Since there were no standardized mobility scooter driving assessments available that were suitable for visually impaired people, we created a new assessment for our purposes. We sought to create content validity by basing our evaluation form on a practical fitness-to-drive assessment for cars (TRIP) and the input of several mobility experts. However, our assessment is neither formally validated nor tested in a preceding pilot study. The driving test used in this experiment might therefore lack certain elements that create difficulties in traffic or it might contain unnecessary scales, which can weaken our findings. Bicycle paths and roads, for example, are frequently used by mobility scooters in the Netherlands, yet our assessment deals with these traffic situations only briefly. Also, confidence or defensive driving are complex concepts and could be the combination of other scales. Future research needs to develop an assessment tool that represents and weights all necessary facets of mobility scooter driving safety in traffic. In addition, the results of the subscales have to be interpreted with caution, since no statistical correction was applied for the number of subscales.
A further limitation could be the restricted age range. Users of mobility scooters are often older than 75 years of age. However, with increasing age, the likelihood of comorbidities, such as impaired cognitive functioning, increases. This, in turn, can have a greater detrimental effect on driving safety than visual impairment alone. By selecting participants between the ages of 50 and 75 years, we sought to isolate the effect of visual impairment on driving safety whilst minimizing the impact of cognitive impairment. It is interesting that participants with a very low visual acuity received, on average, better scores on the subscales compared with participants with low visual acuity, but were involved in more critical events. Apart from the small sample sizes, this might be due to observer compensation: as a precautionary measure the test leader might have pressed the stop button more frequently with participants with very low visual acuity than with those with low visual acuity. The test leader’s knowledge of the participants’ visual abilities might also have contributed to the difference in critical events between visually impaired and normal-sighted participants. A further reason could be the fact that the test leader was not an experienced orientation and mobility specialist. However, the participants’ reaction after they were stopped was predominantly positive and supportive.
Finally, videos of the driving tests, rather than the driving tests themselves, were evaluated by the rehabilitation specialists. The limited camera angles might have made the rating more difficult and therefore less accurate.
Despite the shortcomings discussed above, the present study demonstrated that individuals with various visual impairments are practically fit to drive mobility scooters. The fact that most participants passed the driving test showed that they do not appear to have more difficulties than normal-sighted controls, i.e. the impairment was not markedly visible for a naïve observer. Therefore, this study does not provide support for the introduction of specific visual standards for mobility scooters. In particular, peripheral visual field defects with or without combined low visual acuity can influence safe driving performance and respective individuals deserve special attention in an individualized practical fitness-to-drive test. Further work is needed to establish and weight the necessary criteria for consideration in this driving test.
The authors would like to thank all participants who took part in this study, Rianne van Wingerden and Jannie Schipper for evaluating the videos of the driving test, Linda Schultinga for analysing the visual data, and Hans van Ieperen, Sanne Dellemijn, and Peter Noort for assisting with data collection. Special thanks go to the 3 reviewers who contributed to the improvement of this paper with their valuable feedback. This project is funded by ZonMW, The Netherlands Organisation for Health Research and Development (Nr: 60-00635-98-113).


 Click to show fullsize
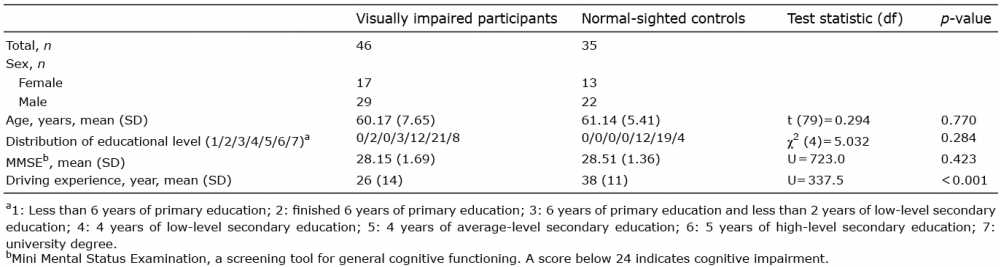 Click to show fullsize
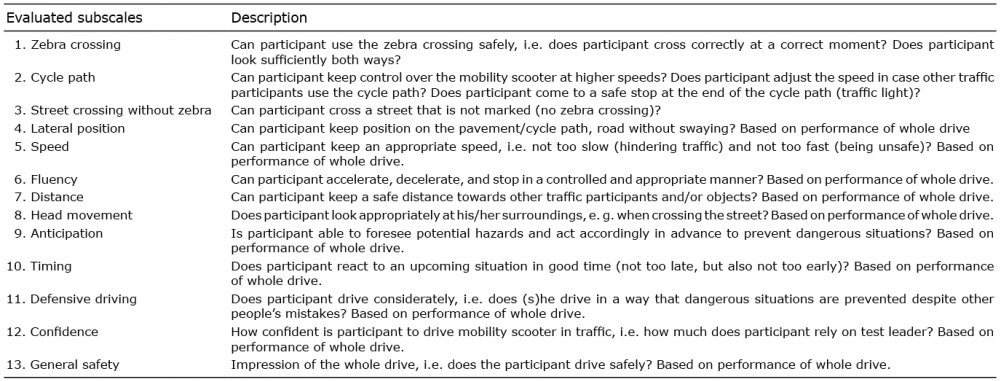 Click to show fullsize
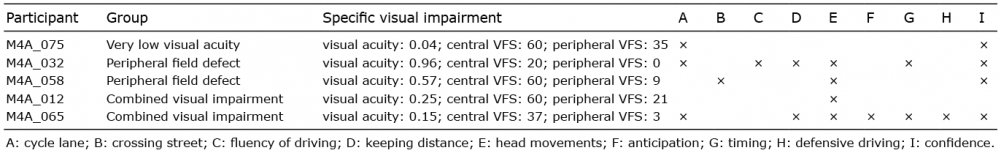 Click to show fullsize
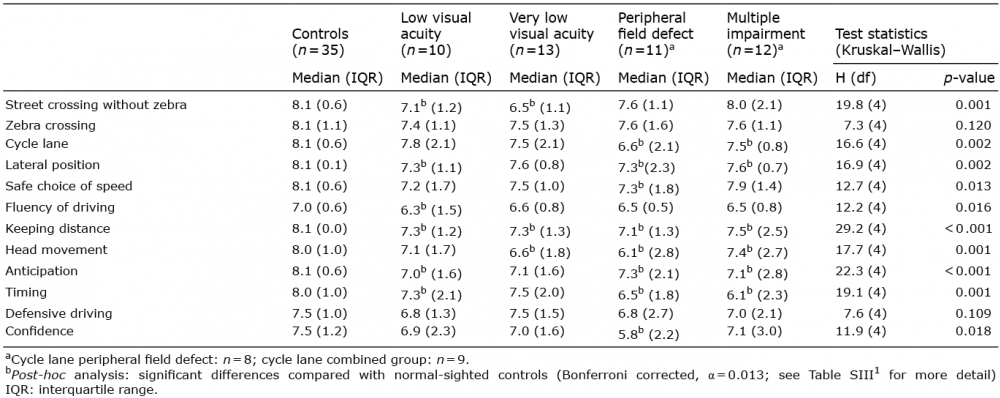 Click to show fullsize
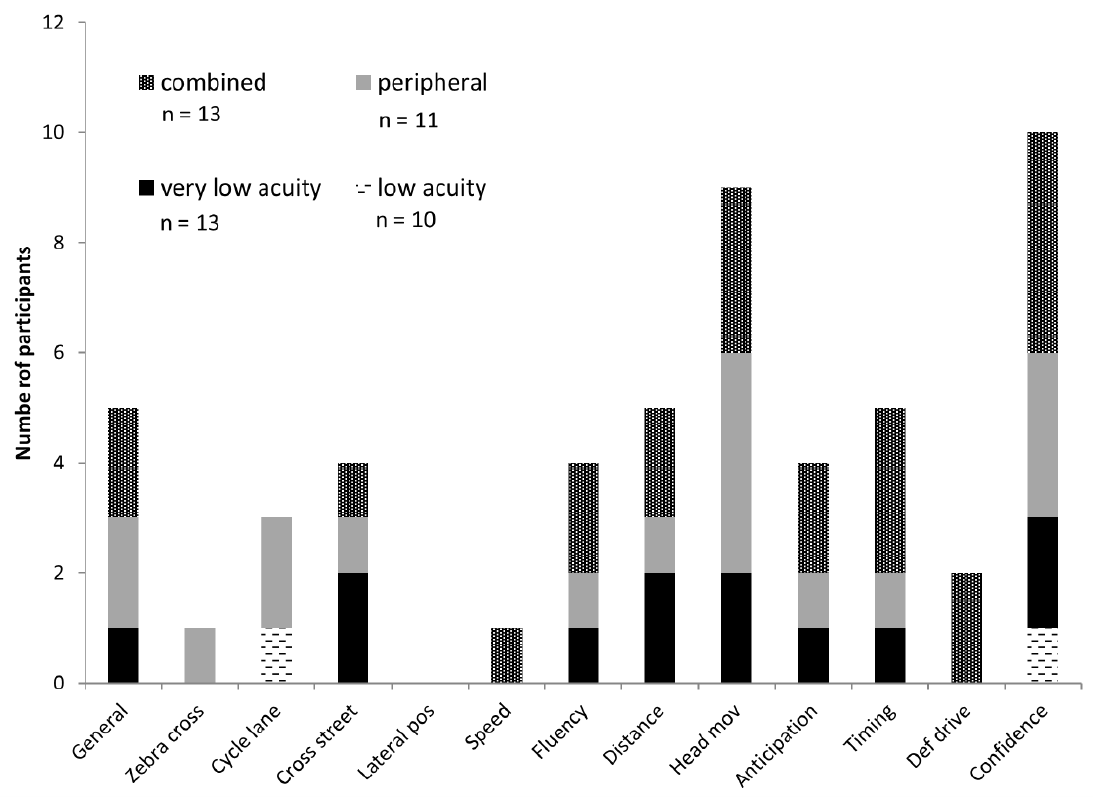 Click to show fullsize
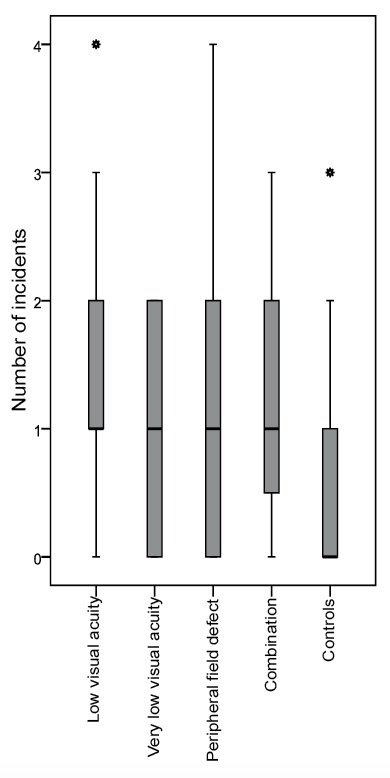 Click to show fullsize