
From the 1Basalt Rehabilitation, The Hague, 2Department of Orthopaedics, Rehabilitation, and Physical Therapy, Leiden University Medical Center, Leiden, 3Merem Rehabilitation Center, Hilversum, 4National Health Care Institute, Diemen, 5Department of Rehabilitation Medicine, Haaglanden Medical Centre, The Hague, 6Department of Rehabilitation Medicine, Reinier de Graaf Gasthuis, Delft and 7Department of Biomedical Data Sciences, Leiden University Medical Center, Leiden, The Netherlands
Objective: To estimate societal costs and changes in health-related quality of life in stroke patients, up to one year after start of medical specialist rehabilitation.
Design: Observational.
Patients: Consecutive patients who received medical specialist rehabilitation in the Stroke Cohort Outcomes of REhabilitation (SCORE) study.
Methods: Participants completed questionnaires on health-related quality of life (EuroQol EQ-5D-3L), absenteeism, out-of-pocket costs and healthcare use at start and end of rehabilitation and 6 and 12 months after start. Clinical characteristics and rehabilitation costs were extracted from the medical and financial records, respectively.
Results: From 2014 to 2016 a total of 313 stroke patients completed the study. Mean age was 59 (standard deviation (SD) 12) years, 185 (59%) were male, and 244 (78%) inpatients. Mean costs for inpatient and outpatient rehabilitation were US$70,601 and US$27,473, respectively. For inpatients, utility (an expression of quality of life) increased significantly between baseline and 6 months (EQ-5D-3L 0.66–0.73, p = 0.01; visual analogue scale 0.77–0.82, p < 0.001) and between baseline and 12 months (visual analogue scale 0.77–0.81, p < 0.001).
Conclusion: One-year societal costs from after the start of rehabilitation in stroke patients were considerable. Future research should also include costs prior to rehabilitation. For inpatients, health-related quality of life, expressed in terms of utility, improved significantly over time.
Key words: stroke; rehabilitation; cost analysis; utility; health-related quality of life.
Accepted Mar 23, 2021; Epub ahead of print Apr 15, 2021
J Rehabil Med 2021; 53: jrm00201
Correspondence address: Winke van Meijeren-Pont, Basalt Rehabilitation/Department of Orthopaedics, Rehabilitation, and Physical, Therapy, Leiden University Medical Center, Wassenaarseweg 501, 2333 AL Leiden, The Netherlands. E-mail: w.pont@basaltrevalidatie.nl
Doi: 10.2340/16501977-2829
The objective of this study was to estimate societal costs and changes in health-related quality of life in stroke patients, up to one year after the start of rehabilitation. Participants were stroke patients who received inpatient or outpatient rehabilitation. They completed questionnaires on quality of life, absenteeism, out-of-pocket costs and healthcare use at start and end of rehabilitation and 6 and 12 months after the start of rehabilitation. Rehabilitation costs were obtained from the financial records. From 2014 to 2016 a total of 313 patients completed the study. Mean age was 59 years, 185 (59%) were male and 244 (78%) inpatients. Mean costs for inpatient and outpatient rehabilitation were $70,601 and $27,473, respectively. For inpatients, health-related quality of life increased significantly between baseline and 6 months, and between baseline and 12 months. In conclusion, societal costs one year after the start of rehabilitation were considerable and health-related quality of life improved for inpatients.
The number of people living with stroke in Europe is expected to increase from 1.1 million per year in 2000 to 1.5 million per year in 2025 (1). Stroke survivors may experience severe functional impairments, including impairments in physical functioning (2), cognition (3), and speech/language (4), which, in turn, lead to limitations in activities and participation and to worse quality of life (QoL) (5). Specialist rehabilitation was proven to be effective in improving functional outcomes after stroke (6), such as motor function, balance, walking speed and activities of daily living (7–9). Furthermore, in stroke patients admitted for inpatient rehabilitation, QoL increased significantly between admission and discharge (10).
Besides the fact that rehabilitation after stroke is effective, rehabilitation was also found to be the main contributor to the costs of post-stroke care, according to a systematic review published in 2018 including 42 publications (11). Costs of post-stroke care, but not those of acute care, were included. Rehabilitation in different care settings was evaluated, which included primary, secondary and tertiary care, and the costs often applied to part of the patients and were not described in detail. For the delivery of value-based healthcare (VBHC), it is important to consider not only the health effects and patient-reported outcome measures, but to also evaluate the costs of care, since it is important to achieve good patient outcomes per dollar spent (12, 13).
The aim of the current study was therefore: (i) to estimate the 1-year societal costs from the start of the rehabilitation in stroke patients treated in a medical specialist rehabilitation facility in The Netherlands; and (ii) to evaluate health changes in terms of utility (an expression of quality of life) over that year.
Design, setting and subjects
This study was part of the Stroke Cohort Outcomes of REhabilitation (SCORE) study; a longitudinal inception cohort study, which is executed in one secondary care rehabilitation facility with multiple locations in the Netherlands. This study has been described extensively elsewhere (14).
In the Netherlands, after a mean of 8 days of hospital admission, approximately 71% of patients are discharged home, 15% are discharged to geriatric rehabilitation, and 14% are referred to inpatient rehabilitation in a medical specialist rehabilitation facility (15). In general, younger, pre-stroke more active patients with complex impairments are admitted to medical specialist rehabilitation compared with geriatric rehabilitation (16). Furthermore, patients referred to medical specialist rehabilitation want to regain a high level of participation, including return to work, family and social roles and leisure activities. Many different disciplines are involved in medical specialist rehabilitation treatment, and the rehabilitation facilities comprise, amongst others, a sports hall and a swimming pool.
Stroke patients are admitted to the rehabilitation facility for inpatient rehabilitation if they: (i) have had a recent stroke preventing them from living independently at home; (ii) are able to take part in at least 2 therapy sessions of 30 min each per day; (iii) are likely to benefit from rehabilitation therapy; and (iv) are expected to live independently after discharge, whether or not with spouse or caregiver. Stroke patients receive outpatient rehabilitation if they meet the same criteria, but are able to live at home. Stroke patients were eligible for the study, if they were at least 18 years old and had a first or recurrent stroke no longer than 6 months previously. Exclusion criteria were being unable to complete questionnaires in Dutch or not providing written informed consent.
This trial is registered at the Dutch Clinical Trial Registration (NL4147 at www.trialregister.nl). The study protocol of the SCORE-project was approved by the Medical Ethics Board of Leiden University Medical Center (LUMC), P13.249, and is reported in accordance with the STROBE guidelines (17).
Assessments
Patients completed questionnaires at the start of the rehabilitation (baseline), at discharge (inpatients) or at the end of the rehabilitation (outpatients) and at 6 and 12 months after baseline. Appendix 1 shows which questionnaires were completed at the different measurement moments. Clinical characteristics and the Barthel Index (BI) were extracted from the patients’ medical file. The BI is a nurse-reported 10-item measurement instrument that scores independence in activities of daily living (ADL) and yields a score between 0 and 20, with higher scores indicating more independence (18).
Of the Stroke Impact Scale (SIS) (19), patients completed the domains communication (7 items), mobility (9 items), memory and thinking (7 items) and hand functioning (5 items). Items were scored on a 1–5-point Likert scale and transformed to a score out of 100 (19), with higher scores indicating a lower level of difficulty experienced with the task. Internal consistency (Cronbach’s α 0.86–0.98) was found to be excellent among stroke survivors and validity was supportive (20).
Healthcare and non-healthcare costs
Societal costs were estimated from the start of the rehabilitation until one year later, separately for inpatients and outpatients. Rehabilitation costs included length of stay in the rehabilitation facility (the number of days for which nursing care was provided) and direct hours of therapy. Volumes and unit prices were obtained from the (financial) administration of the rehabilitation facility. In the patient questionnaires at 6 and 12 months other cost items in the preceding 6 months were assessed. This included healthcare usage outside the rehabilitation facility, out-of-pocket expenses (e.g. for crutches or an electric scooter), informal care, paid home-care and absenteeism. These items were valued using reference prices obtained from the Dutch guidelines for economic evaluations in healthcare (21). If no reference price was available, market prices were used. Absenteeism was valued using the friction costs method, which counts absenteeism for, at most, the duration of the friction period, i.e. the 12-week period considered necessary to fill a vacancy due to long-term sick leave (21). Costs were converted to US dollars (USD) using the purchasing power parity, as listed by the Organisation for Economic Co-operation and Development (OECD) on its website, and are reported at price level 2019 (22). Appendix 1 shows the unit costs.
Health-related quality of life and utility
The patient-reported EuroQol EQ-5D-3L (23) measures health-related quality of life (HRQoL) and consists of 5 domains: mobility, self-care, usual activities, pain/discomfort and anxiety/depression. A visual analogue scale (VAS) records the patient’s self-rated health on a vertical scale with endpoints labelled “Best imaginable health state” and “Worst imaginable health state” (23). Utility scores were calculated from the 5 domains using the Dutch tariff (24) and from the VAS scale. A utility or weight of one reflects complete health, whereas 0 reflects health as poor as death (25). The EQ-5D-3L has shown reasonable validity and reliability (23, 26) and moderate responsiveness (27) for patients with stroke.
Statistical analyses
Data analyses were performed in IBM SPSS version 22 v02 (IBM Corp., Armonk, NY, USA, 2013). To account for systematic missingness, data were imputed using multiple imputation by chained equations (MICE) (28, 29) with predictive mean matching (30, 31) and 100 imputation sets. Missing values for out-of-pocket costs were imputed, based on either the mean price if 50% or more of the participants filled in a price, or market prices otherwise.
Characteristics of patients who did and did not agree to participate, who did and did not complete the study period and inpatients and outpatients were compared using independent-sample t-tests, Fisher’s exact tests or Mann–Whitney U tests, where appropriate. Utility scores were compared using paired-sample t-tests at baseline vs 6 months, baseline vs 12 months, and 6 vs 12 months, respectively. Univariate linear regression analyses with total costs as a function of baseline utility were performed separately for inpatients and outpatients.
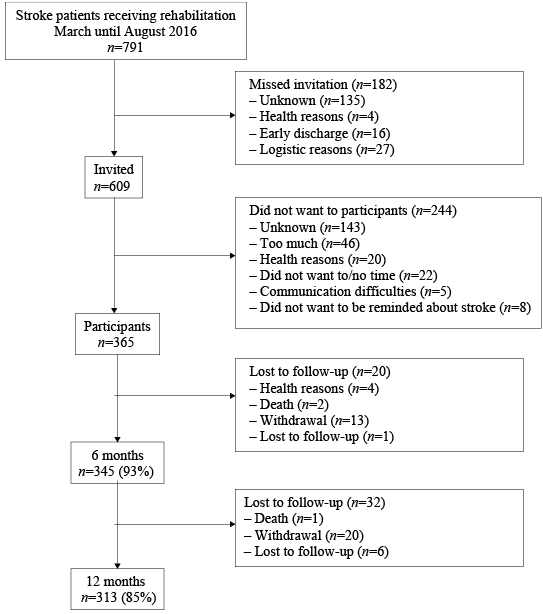
Fig. 1 shows that, between 10 March 2014 and 31 August 2016, 791 stroke patients, were admitted for inpatient or outpatient rehabilitation. Of these, 182 (23%) patients were missed and 609 (77%) patients were invited to participate. A total of 244 (40%) of the invited patients were not willing to participate. A total of 365 (60%) of the invited patients signed informed consent and completed one or more questionnaires. Sex and age did not differ significantly between patients who did and did not participate in the study (mean age 59.7 vs 60.4 years, p = 0.40; percentage male 58% vs 56%, p = 0.66, respectively).
Fig. 1. Flowchart of stroke patients included in the Stroke Cohort Outcomes of REhabilitation (SCORE) study between March 2014 and August 2016.
The 12-month follow-up period was completed by 313 patients. Fifty-two patients dropped out (17%). Baseline characteristics did not differ significantly between patients who did and did not complete the study (see Table I).
Table I. Characteristics of stroke patients admitted for inpatient or outpatient rehabilitation in a rehabilitation facility, completing and not completing the present study
Of those who completed the study, inpatients were significantly older than outpatients (mean age 60 vs 56 years, p = 0.02). Furthermore, inpatients scored significantly better than outpatients on communication (median 92 vs 86, p = 0.01) and memory and thinking (median 89 vs 75, p < 0.01) as measured with the SIS at baseline. Outpatients had significantly better hand function than inpatients at baseline (median 75 vs 50, p = 0.02).
A total of 244 (78%) patients received inpatient rehabilitation, with a median duration of 44 days (interquartile range (IQR) 14–155). Of these, 160 (61%) received outpatient rehabilitation thereafter, with a median duration of 126 days (IQR 72–186). The median duration of rehabilitation for outpatients was 105 days (IQR 70–164).
Of the baseline measurements 5% were missing. Of the QoL, absenteeism, and healthcare use measurements at baseline 12%, 38% (in patients younger than 66 years, who reported that they had paid work at baseline) and 2% were missing.
Costs
Mean total costs were US$70,601 for inpatients and $27,473 for outpatients (see Table II). For inpatients, rehabilitation was the biggest contributor to costs ($46,870; 66%), followed by productivity loss ($10,211; 14%) and informal care ($6,575; 9%). For outpatients, rehabilitation was also the biggest contributor ($9,899; 36%), although to a lesser extent than in inpatients, followed by productivity loss ($9,416; 34%) and informal care ($4,531; 16%).
The costs of rehabilitation therapy for inpatients were approximately 3 times higher than for outpatients ($30,741 vs $9,899). The largest contributor to the costs of rehabilitation for outpatients was physical therapy ($2,579; 26% of the total rehabilitation costs), followed by occupational therapy ($2,061; 21%) and psychology ($1,835; 19%). For inpatients the costs of stay were the largest contributor to the costs of rehabilitation ($16,129; 34%), followed by physical therapy ($7,707; 16%) and occupational therapy ($5,813; 12%).
Table II. Mean resource use and costs among stroke inpatients and outpatients, in the first year after admission to a rehabilitation facility
Utility scores
Fig. 2 shows the utility scores over time, according to the EQ-5D-3L and the VAS. For inpatients, mean baseline utility was 0.66 (standard deviation (SD) 0.27) from the EQ-5D-3L and 0.77 (SD 0.16) from the VAS. For outpatients, mean baseline utility was 0.69 (SD 0.23) from the EQ-5D-3L and 0.79 (SD 0.15) from the VAS. For inpatients, utility improved significantly between baseline and 6 months (EQ-5D-3L, p = 0.01; VAS p < 0.001) and between baseline and 12 months (VAS, p < 0.001). For outpatients there was no statistically significant change over time. The decrease in utility according to the EQ-5D-3L between 6 and 12 months observed in inpatients was not statistically significant (p = 0.11).
Fig. 2. Utility scores calculated from the EuroQoL EQ-5D-3L classification system and from the visual analogue scale (VAS), at start of rehabilitation, 6 and 12 months for stroke patients admitted to a rehabilitation facility. *Statistically significant differences compared with start of rehabilitation.
Tables III and IV show the results of the linear regression analyses with total costs as a dependent variable and utility as an independent variable. Baseline utility from the EQ-5D-3L and VAS are both significantly associated with total costs for inpatients (p < 0.001 for both). For outpatients baseline utility from the VAS was significantly associated with total costs (p = 0.014). For example, an outpatient with a baseline VAS utility score of 0.79 is expected to have total costs of 58,162–38,934 × 0.79 = 27,404 USD, whereas an outpatient with a worse baseline VAS utility score of 0.49 has higher expected total costs, of 58,162–38,934 × 0.49 = 39,084 USD.
Table III. Linear regression analysis of total costs as the dependent variable and utilities as independent variable, for stroke patients who received inpatient rehabilitation (n = 244) in a rehabilitation facility
Table IV. Linear regression analysis of total costs as the dependent variable and utilities as independent variable, for stroke patients who received outpatient rehabilitation (n = 69) in a rehabilitation facility
One-year costs after the start of medical specialist rehabilitation post stroke from a societal perspective were $70,601 and $27,473 for inpatients and outpatients, respectively. For both inpatients and outpatients, rehabilitation was the biggest contributor, yet to a larger extent in inpatients than in outpatients. Both the costs for stay in the rehabilitation facility and for all types of therapy were higher. Productivity loss and informal care were other large contributors to the costs for both inpatients and outpatients. Between baseline and 6 months, and baseline and 12 months, utility improved significantly for inpatients. A linear regression analysis showed that utility at baseline significantly predicted costs.
Communication, memory and thinking and hand function differed significantly between inpatients and outpatients in the current study. Patients with motor problems were more often admitted for inpatient rehabilitation, whereas patients with cognitive complaints more often received outpatient rehabilitation. Using the EuroQol EQ-5D-3L and VAS, significant improvements were found over time in inpatients, but not in outpatients. This could be explained by the smaller number of outpatients or, alternatively, by the fact that the EQ-5D-3L does not explicitly measure cognitive complaints, which are more prevalent among outpatients. The differences between inpatients and outpatients might also partly explain the higher costs of rehabilitation treatment for inpatients. Since the clinical characteristics of inpatients and outpatients differ significantly at admission, it is not valid to compare outcomes in terms of utilities and costs between these groups.
Comparison with the literature
The current results are in line with a previous review, which found that rehabilitation was the main contributor to the costs of post-stroke care, followed by informal care (11). In other studies the costs of medical interventions, physiotherapy, occupational and speech therapy, nursing care, primary care visits, readmissions to hospital due to recurrent stroke, emergency care during the rehabilitation period and other costs, such as medication, community services, transportation, meals on wheels and assistive devices, were included. Although the costs for rehabilitation found in the present study are high, research showed that the benefits for society outweigh the costs (32).
At 6 and 12 months after the start of the rehabilitation EQ-5D-3L utility scores were 0.73 and 0.69 for inpatients and 0.74 and 0.74 for outpatients. These results are mostly in line with a Dutch hospital-based study that found utility scores of 0.74 and 0.74 at 6 and 12 months post stroke, respectively (15). The lower 0.69 utility score for inpatients at 12 months in the current study might be explained by the fact that patients referred to medical specialist rehabilitation are more severely affected by stroke than patients included in a hospital-based study (16).
Rehabilitation facilities in the Netherlands are obliged to work with national guidelines. Yet the recommendations are not very detailed, leaving room for local variation. Previous research showed that there were many similarities, but to some extent there was also some practice variation in the structure and processes of rehabilitation, as delivered by rehabilitation facilities (33, 34). Variation mainly concerned patient subgroups, clinical pathways and the duration of aftercare (34). Practice variation might lead to some difference in costs. However, differences are expected to be small, since health insurers and healthcare providers have made agreements on the price of healthcare, based on the amount of care a patient with a certain diagnosis needs on average. This is also the case for stroke rehabilitation.
Strengths and limitation
A strong point of this study is that there are not many studies on costs of medical specialist rehabilitation that include patient-reported out-of-pocket costs, absenteeism, healthcare usage and utility. Furthermore, different types of therapy during rehabilitation were estimated separately. Evaluating the costs of care is an important aspect in the delivery of value-based healthcare (12, 13).
An important limitation of the present study is that the included costs started at the start of the rehabilitation. Already before the start of the rehabilitation considerable costs are incurred, for example for ambulance care, emergency care, hospital stay, magnetic resonance imaging (MRI), thrombolysis or thrombectomy. Costs in the Netherlands may also not be representative for other healthcare setting. Patient reports about absenteeism and the EQ-5D-3L contained more than 10% missing values. Multiple imputation was used to account for bias, but may not have prevented all bias.
An additional limitation was that absenteeism was self-reported, possibly leading to under-reporting of the time someone was absent (35). Of all patients eligible for participation in this study, 54% were missed or not willing to participate. Therefore, selection bias may have occurred. Although sex and age did not differ significantly between patients who participated in the study and those who did not because they were not invited or refused participation, a limitation of this study is that we do not know whether these patients differed on other characteristics, such as functional limitations. Patients who have more functional or cognitive limitations might not have been able to participate in the study and might need more time to learn and therefore more care. The results of the regression analysis showed that patients with a worse baseline utility have higher total expected costs. Given this lack of information, it remains unclear whether the costs found in the present study could be somewhat over- or under-estimated.
Recommendations for future research
Costs prior to admission to the rehabilitation facility and costs of medication were not included in the present study. For future research it would be recommended to include these costs.
The European Stroke Organisation (ESO) Health Economics Working Group made a protocol to standardize and improve the economic evaluations of interventions for stroke. Resources mentioned in this protocol, but not included in the present study, were amongst others transport, change in residence and living arrangements, medications and more clinical outcomes after treatment (36). Although this was not a comparative study, gathering this data on resources might help to standardize research and compare outcomes. Therefore, in future research it would be recommended to gather data on these resources.
Another recommendation for future research is to consider extracting healthcare usage outside the rehabilitation facility from a health insurer or other central administration system in order to get more complete data. Such administrative data do not rely on patients’ recall, but can be difficult to obtain, and may lack the detail necessary to provide real insight (37). Previous research on the reliability of stroke patients’ reports of general practitioner visits over 12 months found that patients modestly under-reported the number of visits (38).
In conclusion 1-year costs from the start of medical specialist rehabilitation post stroke from a societal perspective were estimated at US$70,601 and $27,473 for inpatients and outpatients, respectively. Future research should include costs prior to the rehabilitation, since considerable costs are incurred in the acute phase. For inpatients, utility improved significantly between the start of the rehabilitation and both 6 and 12 months.
Funding. This work was supported by the Stichting Kwaliteitsgelden Medisch Specialisten.
The authors have no conflicts of interest to declare.
Appendix 1. Questionnaires completed by stroke patients and other data sources, measurement moments and unit costs


 Click to show fullsize
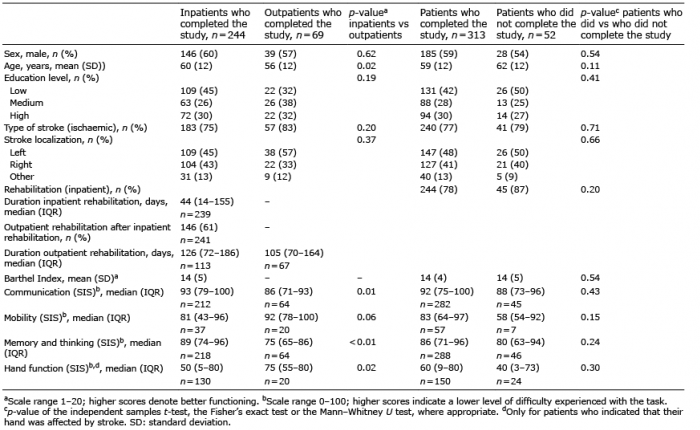 Click to show fullsize
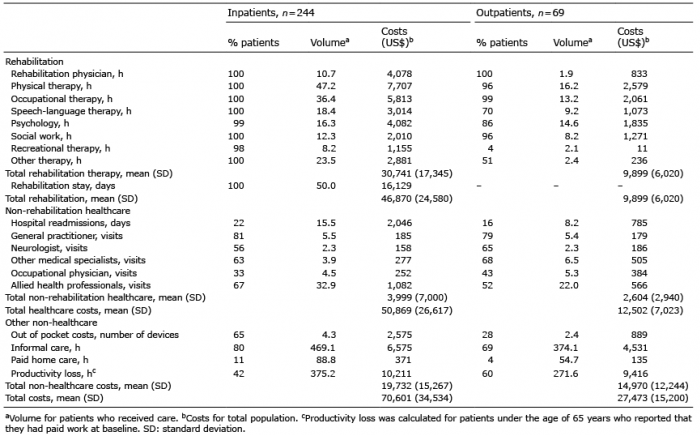 Click to show fullsize
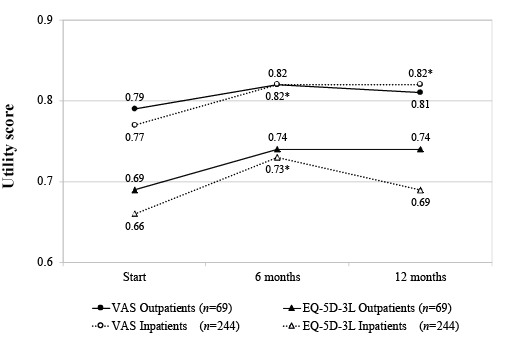 Click to show fullsize
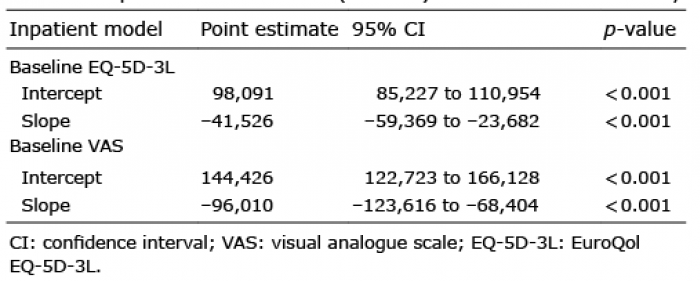 Click to show fullsize
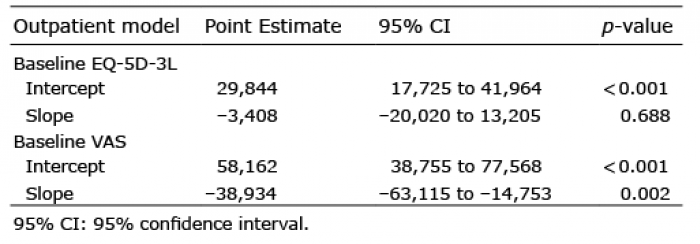 Click to show fullsize
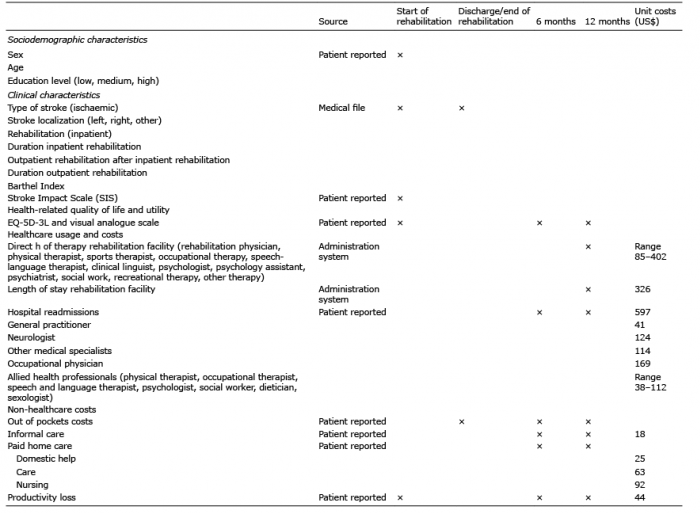 Click to show fullsize