
From the 1Department of Rehabilitation Medicine, Third Affiliated Hospital of Sun Yat-Sen University, Guangzhou and 2Department of Rehabilitation Medicine, Maoming People’s Hospital, Maoming, China
*These authors contributed equally to this work.
Objective: To test whether the presence of N30 somatosensory evoked potentials, generated from the supplementary motor area and premotor cortex, correlate with post-stroke spasticity, motor deficits, or motor recovery stage.
Design: A cross-sectional study.
Patients: A total of 43 patients with stroke hospitalized at Maoming People’s Hospital, Maoming, China.
Methods: Forty-three stroke patients underwent neurofunctional tests, including Modified Ashworth Scale (MAS), Brunnstrom stage, manual muscle test and neurophysiological tests, including N30 somatosensory evoked potentials, N20 somatosensory evoked potentials, motor evoked potentials, H-reflex. The results were compared between groups. Correlation and regression analyses were performed as well.
Results: Patients with absence of N30 somatosensory evoked potential exhibited stronger flexor carpi radialis muscle spasticity (r = –0.50, p < 0.05) and worse motor function (r = 0.57, p < 0.05) than patients with presence of N30 somatosensory evoked potential. The generalized linear model (GLM) including both N30 somatosensory evoked potentials and motor evoked potentials (Akaike Information Criterion (AIC) = 121.99) better reflected the recovery stage of the affected proximal upper limb than the models including N30 somatosensory evoked potentials (AIC = 125.06) or motor evoked potentials alone (AIC = 127.45).
Conclusion: N30 somatosensory evoked potential status correlates with the degrees of spasticity and motor function of stroke patients. The results showed that N30 somatosensory evoked potentials hold promise as a biomarker for the development of spasticity and the recovery of proximal limbs.
Key words: stroke; hemiparesis; spasticity; N30 somatosensory evoked potential; motor evoked potential; function recovery.
Accepted Aug 7, 2021; Epub ahead of print Aug 26, 2021
J Rehabil Med 2021; 53: jrm00223
Correspondence address: Haiqing Zheng, Department of Rehabilitation Medicine, Third Affiliated Hospital of Sun Yat-Sen University, Guangzhou, China. E-mail: zhenghq2@mail.sysu.edu.cn; and Zhenhong Liang, Department of Rehabilitation Medicine, Maoming People’s Hospital, Maoming, China. E-mail: Liang2922615@163.com
Doi: 10.2340/16501977-2867
Impair motor function and spasticity adversely affect the ability to conduct the activities of daily life. Somatosensory evoked potentials and motor evoked potentials are essential to differential evaluation of degree of post-stroke spasticity and stage of motor recovery. This is the first study of the correlations between somatosensory evoked potentials N30, components of somatosensory evoked potentials related to the supplementary motor area and dorsolateral premotor cortex combined with motor evoked potentials and motor function. The results indicate that the N30 somatosensory evoked potential status is correlated with the degrees of spasticity and motor function of stroke patients. The conclusion showed that N30 Somatosensory evoked potentials hold promise as a biomarker for the development of spasticity and the recovery of proximal limbs
Stroke is the leading cause of disability worldwide (1). Most patients with stroke experience motor deficits, which impair motor function and adversely affect their ability to perform activities of daily living (ADL). Spasticity, one of the motor deficits that appears after stroke, is accompanied by an increased risk of falling and resulting fractures, and is associated with increased morbidity and mortality (2). Both post-stroke recovery and the development of spasticity are associated with neural plasticity of different anatomical regions, such as the reticulospinal tracts, supplementary motor area (SMA) and dorsolateral premotor cortex (PMC) (3–5).
Precise biomarkers of motor function are critical for early intervention. The identification of somatosensory evoked potentials (SEPs) is essential for the accurate diagnosis of patients with focal brain disorders, and SEP components reflect the activities of different neural structures (6). N30 SEPs are somatosensory evoked potential components. Anatomically, N30 SEPs are generated from the SMA and PMC (7), from which the corticoreticular tracts radiate (8–10). Pathophysiologically, N30 SEPs present apparent inhibition in individuals with other myotonic disorders (11). Continuous theta burst stimulation of the SMA reduces the amplitude of the N30 (12). Moreover, SMA impairment leads to myodystonia and is closely associated with motor outcomes (13, 14).
Thus, it was hypothesized that the presence of N30 SEPs is related to the degree of spasticity and functional status in people with stroke. The aims of the study were to test: (i) whether the presence of N30 SEPs correlates with post-stroke spasticity (PSS), motor deficits and stage of motor recovery; and (ii) whether the combination of N30 SEPs and motor evoked potentials (MEPs) can be used for the differential evaluation of degree of PSS and stage of motor recovery.
Participant selection
The study protocol was approved by the local Ethics Review Committee of the Medical Faculty of Maoming People’s Hospital (project number PJ2020MI-K180-01). The study was pre-registered at the Chinese Clinical Trials Registry (ChiCTR2000034773) and conducted in accordance with the latest version of the Declaration of Helsinki. The patients consented to the experimental procedure and were informed of the safety and application of transcranial magnetic stimulation (TMS) and electromyography (EMG) in the research.
Forty-three individuals with first-ever stroke participated in this study. All were diagnosed at the Department of Neurology and enrolled at the Department of Rehabilitation Medicine, Maoming People’s Hospital (mean age (standard deviation (SD)) 58.70 years (SD 12.74), 20 females; Table I). Participants had experienced stroke at least 1 month, but no more than 1 year, after inclusion. Inclusion criteria were: first-time, computed tomography (CT)-positive or magnetic resonance imaging (MRI)-positive ischaemic or haemorrhagic stroke resulting in upper extremity (UE) paresis. Exclusion criteria were: upper extremity (UE) Fugl-Meyer Assessment (FMA) score > 63 at enrolment (15); seizure; traumatic brain injury; receptive aphasia; premorbid arm dysfunction; peripheral neuropathy complicated by diabetes; major neurological, medical, or psychiatric illness; inability to provide informed consent; metal located in the head; or implanted cranial or thoracic devices.
Clinical testing
PSS was tested with the Modified Ashworth Scale (MAS), which measures resistance encountered during manual passive muscle stretching using a 6-point ordinal scale (16); grades within this scale with “+” were converted to numerical values for analysis (e.g. 1+=1.5) (17).
The manual muscle test (MMT) was used to determine the extent and degree of muscular weakness on a scale ranging from 0 to 5. Grades within this scale with “+” or “–’’ were converted to numerical values for analysis (e.g. 2+=2.33; 3–=2.66) (18).
The UE motor portion of the FMA (maximum value 66) assesses interjoint coordination and movement fractionation. The FMA arm subscore largely reflects the degree of abnormal movement in the shoulder, arm, and forearm (maximum score 36). Similarly, the FMA hand subscore reflects the degree of abnormal movement in the wrist and fingers (maximum score 30). Each tested movement is given a score of 0 (movement cannot be performed), 1 (reduced strength, speed, amplitude or precision) or 2 (normal). The inability to produce a muscle contraction or perform the FMA was scored as zero.
The degree of motor recovery of the patients was assessed clinically with the Brunnstrom recovery staging system. This system categorizes the sequences of motor recovery after stroke, based on the degree of spasticity and the appearance of voluntary movement.
Somatosensory evoked potentials
The subjects were seated comfortably in a reclining chair with their eyes closed. SEPs were produced by stimulation of the left and right median nerves at the wrist using a 6-channel computerized EMG system (Dantec, Keypoint 9033A07, Denmark). The paretic limb was assessed first. The stimulus rate was set at 1.9 Hz, and the stimulus was 0.2 ms square electrical pulses delivered through a saddle electrode. Simulation was provided until visible twitching of the thumb muscles was observed. SEPs were measured by needle electrodes placed at the F3’ and F4’ positions (19) and bilaterally over the somatosensory areas (C3’ and C4’), and the reference electrode was placed at Fz based on the 10–20 International System (Fig. S1A). The level of electrode impedance was less than 5,000 Ω. To ensure the reproducibility of the evoked response components, a minimum of 2 trials were performed. The evoked potentials were calculated by averaging the recordings at every 500 stimuli, and the responses were filtered with a bandpass filter from 3 to 30 Hz (20). The existence of N30 and N20 SEPs was defined as potentials within 3 SD of the mean value of the normal data from the healthy side (21). Outside of this range, the absence of SEPs was defined (Fig. S2).
Transcranial magnetic stimulation neurophysiology
Each patient lay in a supine position, with his or her forearms resting on a bed in a totally relaxed position. Surface EMG signals from the abductor pollicis brevis (APB) muscle were recorded bilaterally. Electrodes (10-mm- diameter Ag-AgCl electrodes) were taped in a muscle belly-tendon orientation at fixed distances from bony and tendinous landmarks, and the positions were recorded to ensure consistent electrode placement across sessions. Single-pulse TMS was delivered using a Magpro X100 stimulator (Dantec, Denmark) via a 97-mm figure-eight coil (Magstim®). The stimulation site was the primary motor cortex (M1) with the coil handle posterolaterally oriented 45° from the midline. To precisely locate the area producing the largest MEP amplitude in the contralateral muscle (the “hotspot”), first a search was performed in a ~1 cm-step grid pattern at 60% of the maximum stimulator output (%MSO) for the resting motor threshold (RMT) or the %MSO eliciting at least 5 out of 10 MEPs ≥ 50 μV. Using this %MSO and preliminary hotspot, another grid search was performed, and a new RMT was determined to refine the location of the hotspot. Each individual’s hotspot was confirmed bilaterally during each session. If a more responsive location was found during the retest, this new hotspot was used. Hotspots were identified in both hemispheres. Ten trials were recorded at 100% MSO with the muscle at rest, with an interstimulus interval of 15 s (22). Trials in which EMG activity > 50 µV was recorded in the 150 ms prior to stimulus were discarded. Resting MEPs were considered present when ≥ 2 deflections with a peak-to-peak amplitude > 50 µV occurred within 40 ms and at the same time post-stimulus; otherwise, MEPs were considered absent (15). The reason MEPs were elicited at rest instead of during a contraction was to eliminate the effect of variable spinal excitability on MEPs due to varying degrees of dysfunction of the upper limb.
H-reflex assessment
The maximum H-reflex and maximum M-response were assessed. The measures were made with the forearm in supination. The Dentec EMG machine (Denmark) was used to record the H-reflexes and M-responses. The bandpass filter was set to range from 5 to 3 kHz, the sweep rate was 5 ms/div, and the sensitivity was 2–500 mV/div. Rectangular electric pulses with a duration of 1 ms were repeated every 5 s, and the output amplitude ranged from 0 to 100 mA. The median nerve was stimulated at the elbow crease using a saddle electrode. The recording electrodes were placed over the muscle belly of the flexor carpi radialis (FCR) muscle. Paired surface electrodes (Ag/AgCl) were used. An active electrode was placed on the belly of the FCR at one-third of the proximal distance between the medial epicondyle of the humerus and the radial styloid (Fig. S1B). The electrical resistance between the 2 electrodes was less than 10 kΩ. The ground was attached to the skin between stimulating and recording electrodes. H-reflexes and M-responses were recorded during stepwise increases in stimulus intensity from below threshold for the H-reflex to that eliciting a maximal M-response. The intensity of pulses was increased gradually in 0.2 mA increments (23).
Statistical analysis
The baseline demographics, stroke factors, and neurological function assessment results are presented as means (SD). The normality of the data was tested with the Shapiro–Wilk test. For data that were normally distributed and homogenous in variance, the independent sample t-test was used. For data that were normally distributed and heterogeneous in variance, the Welch 2-sample t-test was used. The nonparametric Mann–Whitney U test was used for non-normally distributed data. Comparisons of neurological function assessment results between N30 SEP-absent and N30 SEP-present groups were performed using the Mann–Whitney U test, with correction for multiple comparisons performed by the false discovery rate (FDR) approach. Spearman’s rho test was used to assess the relationships among all of the indexes, and the Cocor function in R language was used to calculate the correlation coefficients (24). Correlation strength was interpreted as follows: 0.00–0.09, none; 0.10–0.30, low; 0.30–0.50, moderate; and 0.50–1.00, high (25). The independent effects of MEP and SEP on MAS and Brunnstrom stage were assessed using a generalized linear model (GLM) to analyse the categorical and continuous data, and the adjusted model was developed by backward elimination using a significance level of 0.2 to enter and 0.05 to stay. In the model for MAS, MEPs were eliminated from the adjusted model. In the model for hand Brunnstrom stage, N30 SEPs were eliminated from the adjusted model. The differences in deviance between 2 models (simple and complex) were tested with a χ2 test. A likelihood-ratio test (LRT) was used to test whether the inclusion of an additional parameter to a distribution significantly improved model fit. An LRT p-value less than 0.05 suggests that the improvement is significant. Significance was set at 0.05. All data were analysed using GraphPad Prism, version 6.0, and R version 4.0.3.
Participant characteristics
The characteristics of the subjects are shown in Table I and Fig. 1. Among the 43 stroke patients enrolled, the mean (SD) age was 58.70 years (SD 12.74), and 20 of the patients were female. Approximately 75% of patients had subcortical lesions, and approximately 35% had mixed cortical and subcortical lesions. Among the 15 patients with mixed lesions, only 2 had mild lesions, in the frontal and parietal lobes. Twenty-four patients had impaired right hand. The mean (SD) FMA score of the 43 patients was 31.40 (SD 18.78), and all enrolled patients had different degrees of impairment of hand function. All 43 patients completed the SEP and MEP examinations; however, 1 patient refused to undergo the H-reflex examination, and 7 of the patients did not yield H-reflex data because of physiologically elicited difficulty, which was verified with an examination on the unaffected side.
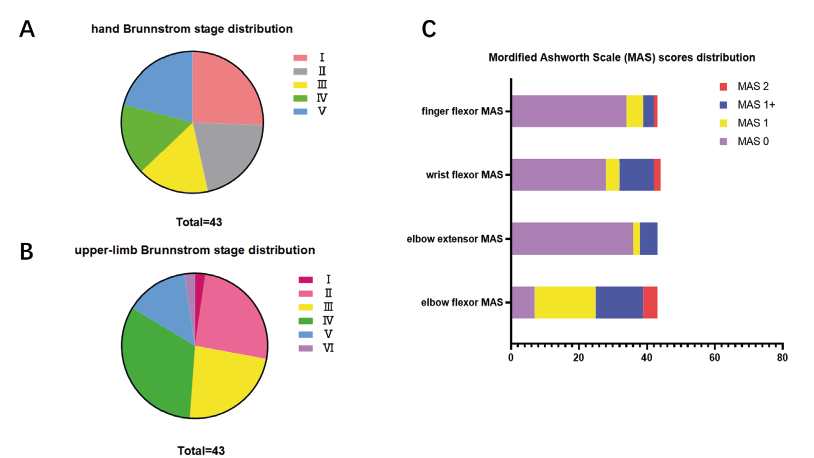
Fig. 1. The proportions of different degrees of the Modified Ashworth Scale (MAS) and Brunnstrom stages of patients with stroke. (A) Individual hand Brunnstrom stage distribution showed that 20.93% of all individuals were in stage 5 (9 out of 43; hand Brunnstrom stage 5) and 79.07% of them were in worse recovery stage (34 out of 43; Brunnstrom stage 1–4). (B) Upper-limb Brunnstrom stage distribution showed that 1 of 43 individuals was in stage 6 and 6 of them in stage 5; 83.72% of them were in worse recovery stage (36 out of 43; Upper-limb Brunnstrom stage 1–4 ). (C) Individual elbow flexor distribution showed that 83.72% of all individuals showed spasticity (36 out of 43; MAS 1,1+,2) and 7 of them showed no spasticity; 16.28% of all individuals showed elbow extensor spasticity (7 out of 43; MAS 1,1+); 34.88% of the patients showed wrist flexor spasticity (15 out of 43; MAS 1,1+,2); 9 of them survived with finger flexor spasticity (MAS 1,1+,2).
Table I. Patients’ characteristics
Influence of N30 status on post-stroke spasticity
In order to eliminate the influence of spinal excitability on the somatosensory ascending pathways and exclude the possibility of diabetes affecting peripheral nerves, this study compared the H-reflex latency and H/M ratio between the groups with and without N30 SEPs. The results showed no differences in spinal excitability between the 2 groups (zH-reflex latency=1.05, p = 0.30; zH/M=0.16, p = 0.88) (Fig. S3). The results indicated that there is little effect of spinal excitability on SEP components. Then, the study characterized the association between N30 status and PSS (Fig. 2). As shown in Fig. 2, the patients categorized as N30 SEP absent presented higher levels of muscle tone than did the patients who were N30 SEP positive (U = 115.5, p < 0.01; r = –0.50).
Fig. 2. Modified Ashworth Scale (MAS) degrees of the patients with and without elicited N30 somatosensory evoked potentials (N30 SEPs). The MAS degrees of the elbow flexor, elbow extensor, wrist flexor and finger flexor were compared between the N30 absent group and the N30 present group. The N30 absent group exhibited stronger wrist flexor spasticity than the N30 present group (p < 0.01). The elbow flexor MAS, elbow extensor MAS and finger flexor MAS of N30 absent group showed no statistical significance compared with the N30 group. Red dots and green squares represent the different N30 SEPs status groups and correspond to the mean. The bars mean the extent of standard deviation (SD). **p < 0.01.
Influence of N30 status on segmental clinical assessment
Segmental clinical functional status was assessed before all of the electrophysiological tests were performed. As shown in Fig. 3, the patients who were N30 SEP absent exhibited decreased muscle strength and dexterity among all segments of the upper limbs (p < 0.05). The study analysed the correlation between the N30 SEP status and the clinical assessment subscore of each segment of the upper limbs and compared the strengths of the correlations among segments (Fig. 4). Of note, the strength of the correlation of upper-limb Brunnstrom stage with N30 SEPs (r = 0.57, p < 0.001) was different from that of hand Brunnstrom stage with N30 SEPs (r = 0.38, p = 0.012) (z = 2.38, p = 0.009).
Fig. 3. Comparison of segmental functional status between patients with and without N30 somatosensory evoked potentials (N30 SEPs). The normalized manual muscle testing (MMT) values of the shoulder, elbow flexor, elbow extensor, wrist flexor, wrist extensor, finger flexor and finger extensor; MMT, Fugl-Meyer Assessment score (FMA) and Brunnstrom stage were compared between the N30 absent group and the N30 present group. In N30 SEPs present patients, the MMT values of different upper limb segments were higher than those in N30 absent patients (p < 0.05). The N30 present group were in a better recovery stage than those without N30 present (p < 0.05). The FMA values of different upper limb segments were higher in N30 present group (p < 0.001). Brown frame represents N30 SEPs absent group; Green frame represents N30 SEPs present group. The frames show the probability density of the patients at mean control values, and the median line in the frames corresponds to the median, and lines distributed on both sides of the middle line correspond to the interquartile range (IQR). Mean control: the ordinate presents values expressed as a multiple of the mean value from N30 SEPs absent subjects. *p < 0.05; **p < 0.01; ***p < 0.001.
Fig. 4. Heat map matrix of the correlations of all variables. Correlations were calculated among those variables with significant differences between the N30 somatosensory evoked potential (N30 SEP) absent group and the N30 present group, such as Modified Ashworth Scale (MAS), Fugl-Meyer Assessment score (FMA), and Brunnstrom stage, and those variables that are clinically important, such as age, sex, sensory disorder, and type of stroke. The presence of N30 SEPs was negatively correlated with wrist flexor MAS (r = –0.50, p < 0.05) and positively correlated with motor evoked potentials (MEPs) (r = 0.47, p < 0.05), manual muscle testing (MMT) (r = 0.42, p < 0.05), FMA (r = 0.57, p < 0.05), FMA (r = 0.48, p < 0.05) and Brunnstrom stage(r = 0.57, p < 0.05). Blue squares correspond to positive correlation; red squares correspond to negative correlation (the darker the colour, the stronger the correlation).
Influence of N30 plus motor evoked potentials status on post-stroke spasticity and neurofunction
Ordinal logistic models were established to test the utility of N30 SEPs and MEPs for clinical evaluation. As shown in Table II, among models 1 to 3, the model containing N30 SEPs yielded the best performance only for the evaluation of wrist flexor spasticity (χmodel2=10.85, p < 0.001). This finding indicates that the neural substrates of N30 SEPs play a role in spasticity. Both N30 SEPs (χmodel5=16.21, p < 0.001; χmodel8=6.47, p < 0.05) and MEPs (χmodel4=13.81, p < 0.001; χmodel7=20.97, p < 0.001) can be used to evaluate the segmental clinical functional status. To determine the value of using both N30 SEPs and MEPs to evaluate the segmental functional status of the upper limb, the study constructed a model that included both N30 SEPs and MEPs; moreover, the likelihood-ratio (LR) χ2 test was used to compare the models that contained only MEPs or N30 SEPs with the model containing both. The combination of the 2 types of potentials led to improved upper-limb Brunnstrom stage evaluation results compared with the inclusion of only MEPs (T = 7.46, p < 0.01) or N30 SEPs alone (T = 5.07, p < 0.05). It should be noted that the relationship above did not apply to the evaluation of the hand Brunnstrom stage: the model containing both N30 SEPs and MEPs did not yield better fit than the model containing MEPs only (T = 0.19, p = 0.67).
Table II. Results of ordinal regression analysis of N30 somatosensory evoked potentials (N30 SEPs) and motor evoked potentials (MEPs) affecting the segmental Brunnstrom stage
Post-hoc analysis of the correlations between N30 and other indexes when N20 somatosensory evoked potentials were presented
To eliminate the influence of impairment of the somatosensory pathway from the spinal cord (SC) to the thalamus and somatosensory cortex on the N30 SEP status, this study examined the correlations between N30 and the other indexes mentioned above among 33 patients positive for the presence of N20/P25 SEPs (21). The results indicate that when the somatosensory pathway from the SC to the thalamus was present, the patients who were N30 SEP absent presented higher levels of muscle tone than those who were N30 SEP positive (U = 51, p < 0.01) (Fig. S4). Compared with those with N30 SEP absence, the patients with N30 SEP presence tended to be in a better recovery stage (Uupper-limb Brunnstrom stage=34.5, p < 0.01) and showed better motor function (Ushoulder-elbow FMA=41, p < 0.05; Uwrist-finger FMA=43, p < 0.05) (Fig. S5). These findings suggest that the neural substrates represented by the N30 SEPs are related to the development of spasticity and the segmental functional status in different ways and are better for indicating the proximal recovery than the distal recovery of the upper limb.
This is the first study to report that the absence of N30 SEPs after a stroke is related to wrist flexor spasticity and lower clinical functional of the upper limb. This study is also the first to demonstrate the complementary assessment of N30 SEPs combined with MEPs in the proximal limbs. The findings indicate that N30, a neglected index, can be used to explore the pathophysiological mechanism underlying recovery after stroke and to supplement clinical management.
Influence of N30 somatosensory evoked potentials on spasticity
This cross-sectional study first evaluated the relationship between N30 SEPs and spasticity, and the results suggest that individuals without N30 SEPs may develop more severe wrist flexor spasticity than those with N30 SEPs. Although no significant difference in spasticity between N30 SEP presence and absence was observed for other segments of the upper limb, patients who presented with N30 SEPs tended to develop less severe spasticity, as shown in Fig. 4.
As reported previously, N30 SEP amplitudes are lower in patients with Parkinson’s disease (PD) than in healthy controls (26–28), and the N30 SEP status has been found to be negatively correlated with the degree of myodystonia in patients with PD (29). Moreover, the N30 SEP amplitude transiently increases after peaks of levodopa concentration (30). Chung et al. (31) reported that levodopa modulates beta-band oscillations in the supplementary motor cortex through basal ganglion activity and is associated with increased movement velocity and increased voltage of agonist muscle activity in patients with PD. These clinical findings show that the status of N30 SEPs is correlated with motor function and muscle tone. Although N30 SEPs were thought to be located in Brodmann’s areas 1 and 3b based on the tangential model (32), a recent review showed that N30 SEPs were also located in the SMA and PMC, including both Brodmann’s areas 6 and 8 (7). The relationship between N30 SEPs and muscle tone may be interpreted as follows: the afferent signal of SEPs not only activates the thalamus, but also the basal ganglia, which leads to activation of cortical premotor circuits and the selection or facilitation of movement (33). The SMA, PMC, basal ganglion are the areas responsible for the development of spasticity, affecting motor control, postural maintenance and muscle tone (10, 11, 34).
In summary, we postulate that the N30 SEP status correlates with wrist flexor spasticity because this status reflects the activities of the SMA, PMC and basal ganglia circuit (7).
Influence of N30 SEPs on the segmental clinical functional status of the upper limb
The results of the current study provide the first documentation of patients without N30 SEPs exhibiting poorer functional outcomes than patients with N30 SEPs. Furthermore, it was found that the correlations between N30 SEPs and different segmental functional statuses varied in strength; notably, the variation in correlation strength is consistent with some pathophysiological phenomena. For example, with functional assessment scales that explicitly concern the movement impairment of fingers, such as the hand Brunnstrom stage, the correlation of N30 SEPs with hand Brunnstrom stage was not statistically significant. For the functional assessment subscale of the UE-FMA that mainly assesses muscle strength during gross movement of the wrist and hand, the correlations of N30 SEPs with the hand-wrist subscale of the UE-FMA were significant. This phenomenon account for the fact that sensory feedback operates in many ways during motion, including feed-forward signals for motor initiation and correction during movement (35). N30 SEPs are thought to be generated from the SMA and PMC (7), and functional improvement in the proximal and axis muscles is accompanied by rebalancing of interhemispheric activity between the SMA and PMC at the level of the cortex during stroke recovery (27, 28, 36). At the spinal level, after stroke, more than 50% of terminals increasing in lamina VII are projected from the SMA (37). The discharges of reticulospinal tracts generated from the SMA and PMC affect the strength of the proximal muscles of the upper limb (4,9, 37), while fine movements of the fingers depend mostly on corticospinal tracts (38), which can be reflected by the MEPs of the APB. These observations might explain why the ordinal logistic model that included both N30 SEPs and MEPs achieved better performance than the other models in evaluating the upper-limb Brunnstrom stage of stroke patients, whereas the model containing MEPs alone was better for evaluating the hand Brunnstrom stage of stroke patients. In short, the neural substrates represented by the N30 SEPs differentially affect the segmental functional status, with stronger effects on the proximal part of the upper limb.
Influences of N30 SEPs plus motor evoked potentials on spasticity and the segmental clinical functional status of the upper limb
N30 SEPs and MEPs were initially considered together in this study to evaluate the segmental functional status of the upper limb. With regard to spasticity, the results showed that the model containing only N30 SEPs achieved better performance in evaluating the MAS degree than the model containing both N30 SEPs and MEPs or the model containing only MEPs. This finding prompts the conclusion that N30 SEPs contribute more explanatory power to the model of spasticity in wrist flexor muscles than to models for other segments, which may indicate that the neural substrates represented by N30 SEPs are a surrogate marker for patients who develop spasticity. Although the MEPs did not add any value to the model containing N30 SEPs in evaluating the degree of wrist flexor spasticity, the presence of MEPs correlated with wrist flexor spasticity. It has been reported that selective damage to the pyramidal tract leads to weakness, loss of dexterity, hypotonia, and hyporeflexia, but not to spasticity (4). However, Lee et al. (39) found that isolated pyramidal tract damage could lead to spasticity, which indicates that the relationship between MEPs and spasticity needs further exploration. The current results showed that the use of both N30 SEPs and MEPs can have greater value in evaluating the upper-limb Brunnstrom stage than the use of N30 SEPs or MEPs alone, even though N30 SEPs and MEPs correlated with Brunnstrom stage to similar degrees. With regard to the model for hand Brunnstrom stage, N30 SEPs did not show any added value when added to the evaluation model that contained only MEPs.
The predict recovery potential (PREP) algorithm is a widely adopted motor prediction model that sequentially assesses clinical, TMS and neuroimaging parameters (40). However, PREP does not include parameters that reflect the functional status of somatosensory pathways, which contribute to motor function by providing sensory information; moreover PREP does not differentiate the segmental recovery potential of the upper limbs, which follows a different time course and depends on different neural substrates (15). As stated above, our models indicate that N30 SEPs plus MEPs can better represent the functional status of the proximal upper limb than either type of potential alone, while MEPs alone can better explain the functional status of the distal extremity. Therefore, N30 SEPs may be used to supplement PREP to help with precise clinical management. However, additional studies should be conducted to clarify the exact neural structure generating the N30 SEPs and its function.
This study has several limitations. The study population included only subjects who had MAS < 3, and only 5 of them with MAS 2, thus reducing the generalizability of the results. In addition, because of the methodological challenge of eliciting proximal MEPs, this study examined only those MEPs from the abductor pollicis brevis to assess the MEP status, even though there was no difference between proximal and distal location in the strength of the relationship between the functional status and MEPs. However, more precise muscle assessments are necessary to determine the characteristics of recovered neural substrates. Moreover, further research is needed to identify the exact physiological sites where the N30 SEP is generated and its relationship with dysfunction of patients after stroke.
In conclusion, this study verified the relationships among the N30 SEPs status, PSS and the segmental clinical status, and found that the N30 SEPs status correlated with spasticity and the segmental functional status of the upper limb. These initial findings showed that N30 SEPs have added value in evaluation models for wrist spasticity and proximal upper limb, providing better performance than models that include only the parameter MEPs. This work provides a possible biomarker for interpreting spasticity and the degree of recovery of segmental functional status. Further research is required to identify the physiological sites where the N30 SEP is generated and its relationship with the dysfunction of patients after stroke.
This work was supported by grants from the National Natural Science Foundation of China (81972151, 81572228) and the Guangdong Basic and Applied Basic Research Foundation (2019A1515011106).
The authors have no conflicts of interest to declare.


 Click to show fullsize
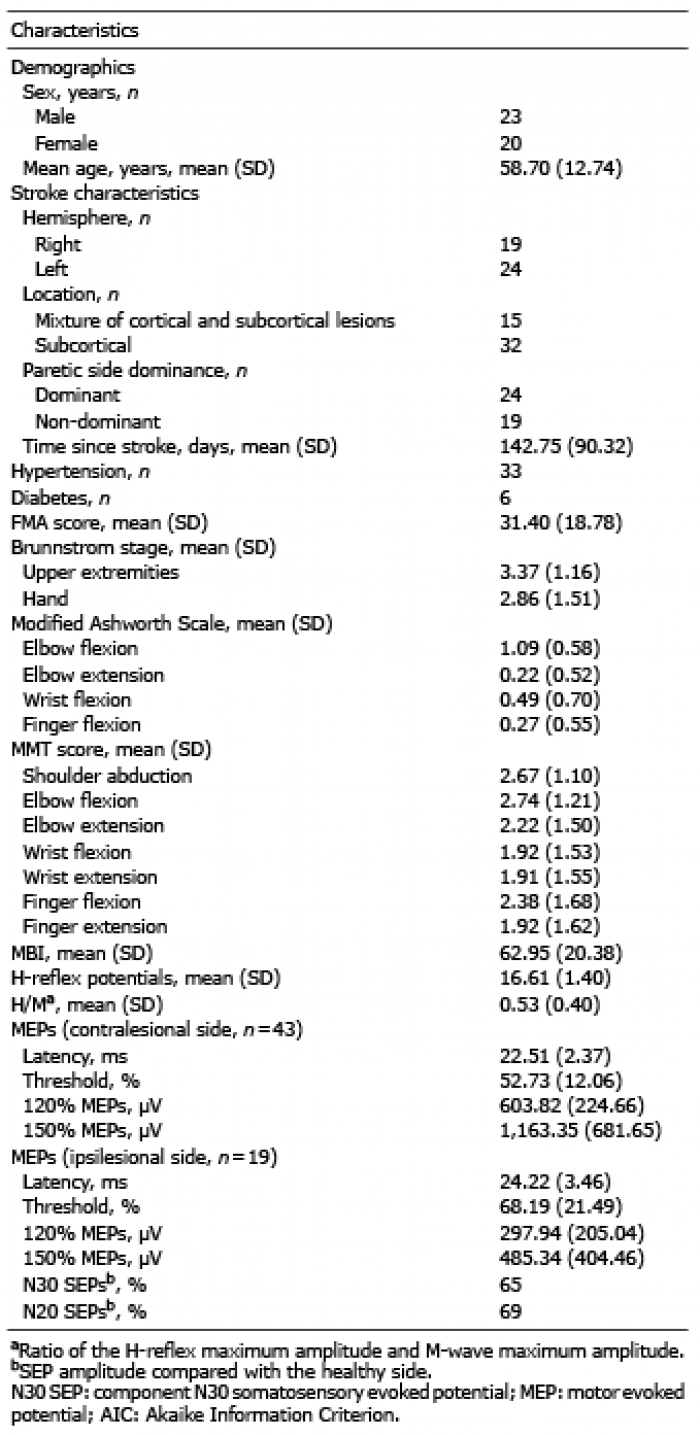 Click to show fullsize
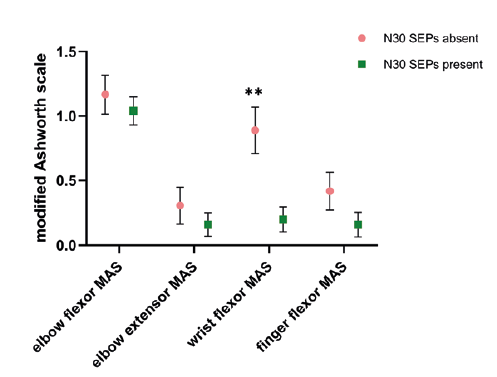 Click to show fullsize
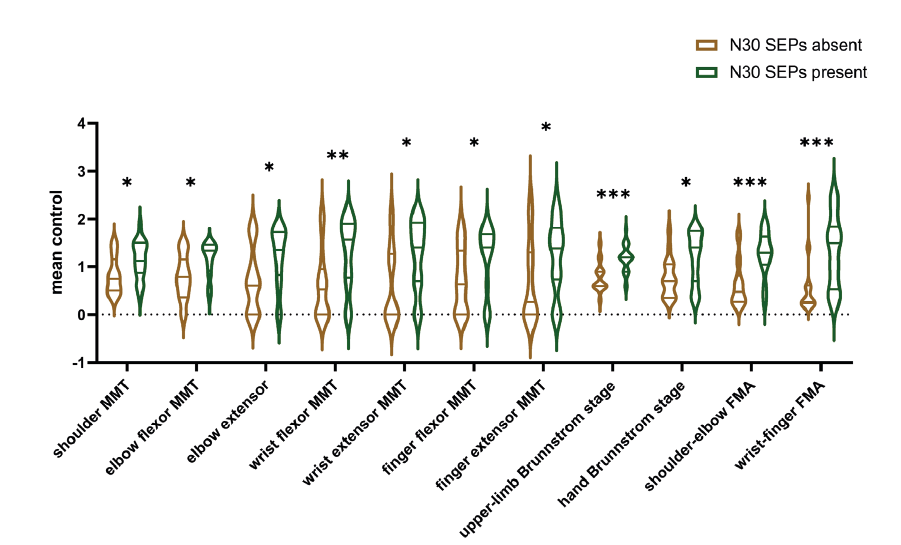 Click to show fullsize
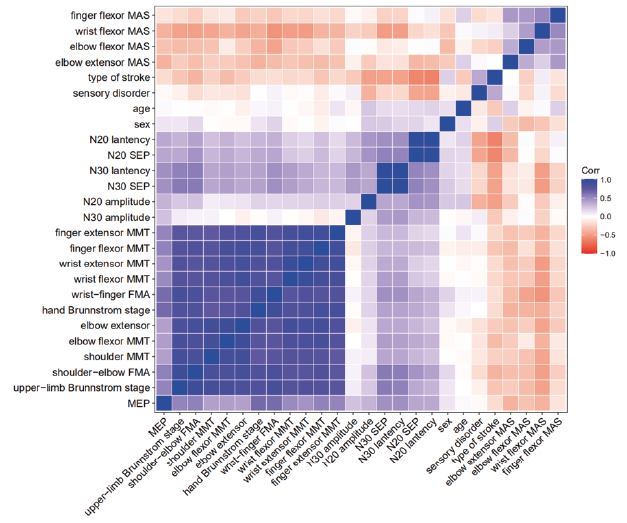 Click to show fullsize
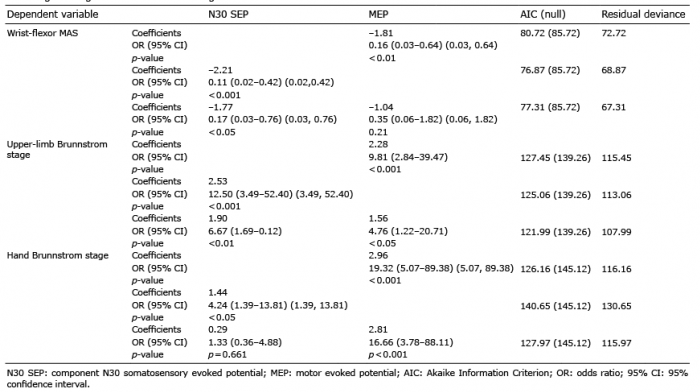 Click to show fullsize