


1Division of Dermatological Allergology, Departments of 2Dermatology, 3Biophysics and Cell Biology and 4Immunology, and 5DE-MTA “Lendület” Cellular Physiology Research Group, Faculty of Medicine, University of Debrecen, Debrecen, Hungary
#These authors contributed equally to this work.
Skin dendritic cells of patients with atopic dermatitis (AD) are well characterized, but less is known about their peripheral blood precursors. The aim of this study was to investigate the phenotypic features and chemokine production of myeloid pre-dendritic cells of patients with AD ex vivo and after stimulation with Staphylococcus enterotoxin B and thymic stromal lymphopoietin, representing an AD-like microenvironment. The expression of cell surface markers was measured by flow cytometry, while chemokine production was monitored with chemokine antibody array and confirmed by enzyme-linked immunoassays. AD pre-dendritic cells expressed higher levels of FcεRI and the maturation and activation markers tended to be altered. They produced both AD (CCL17/18/22) and maturation-related (CCL3/4/5) chemokines at higher level than controls. The production of CCL3/4 and CCL18 were significantly higher even without AD-specific stimulation, while the production of CCL17 and CCL22 were significantly higher only after stimulation. These results indicate that circulating AD pre-dendritic cells are premature and bear atopic characteristics even without tissue-specific stimulation, suggesting that their development is not only influenced by the skin microenvironment, but even earlier by the local milieu in the blood.
Key words: atopic dermatitis; dendritic cells; cell surface markers; chemokine.
Accepted Oct 3, 2016; Epub ahead of print Oct 4, 2016
Acta Derm Venereol 2017; 97: XX–XX.
Corr: Andrea Szegedi, Division of Dermatological Allergology, Department of Dermatology, Faculty of Medicine, University of Debrecen, 98. Nagyerdei krt., HU-4032 Debrecen, Hungary. E-mail: aszegedi@med.unideb.hu
Atopic dermatitis (AD) is a common inflammatory skin disease, in which both T cells and dendritic cells (DC) play crucial roles in the development of skin inflammation. AD is characterized by Th2- and Th22-type T-cell infiltration in both the initial and chronic phases (1–6).
Beside T cells, DCs also represent the main participants in the pathogenesis of AD, since they contribute to inflammation both through their T-cell-polarizing capacity, and through direct cytokine and chemokine production. DCs serve as sentinels of the immune system and represent a heterogeneous family of myeloid cells. Skin myeloid DCs can be classified according to their tissue location and their surface molecule expression: Langerhans’ cells ((LCs) CD207+(Langerin+), CD1a+, FcεRI+)) are the main cell types of the epidermis (7), whereas dermal myeloid DCs (CD11c+, CD1c+, FcεRI +) can be found throughout the entire dermal compartment. Under inflammatory conditions, such as in AD skin, yet another cell type, the inflammatory dendritic epidermal cells ((IDECs) CD1a+, CD206+)) develops (8, 9).
In addition to monocytes, blood DCs are thought to be the precursors of DCs located in the skin and other tissues (10, 11), and are often described as precursor DCs (pre-DCs). The precursor-progeny connection between CD1c+ blood DCs and tissue CD1c+ DCs is also supported by in vitro differentiation and gene expression analysis (12). In AD, it has emerged that peripheral blood pre-DCs can serve as precursors, not just of dermal DCs, but also of skin inflammatory DCs (11, 13).
In addition to their T-cell-polarizing cytokine production DCs are also important sources of chemokines. Several research groups have observed that in patients with AD skin DCs produce mainly CCL17, CCL18 and CCL22 (3, 14). CCL17 and CCL18 are considered as AD-related chemokines produced by skin myeloid DCs, which play a role in the trafficking of memory T cells and in regulating the Th2 immune response. CCL22, which is also an AD-related chemokine, is considered to be released mainly by plasmocytoid DCs (3). On the other hand, little information on the chemokine production of blood DCs in AD is available.
Since the peripheral blood pre-DCs are poorly characterized in AD, we aimed to examine their characteristic features. In our previous study, AD pre-DCs showed differences in the production of T-cell-polarizing cytokines compared with pre-DCs from healthy controls (15). The present study continues the detailed phenotypic characterization of these cells, focusing on their activation and maturation stage and their chemokine production, in order to determine whether they differ from myeloid pre-DCs of healthy individuals ex vivo and after stimulation with Staphylococcus enterotoxin B (SEB) and thymic stromal lymphopoietin (TSLP), which represent an AD-like microenvironment. Our results indicate that peripheral blood pre-DCs derived from patients with AD are more mature than control pre-DCs and that they are able to produce chemokines that are either AD specific or represent their early maturation stage even without stimulation, although this chemokine profile became more intense and disease-specific after tissue-specific stimulation.
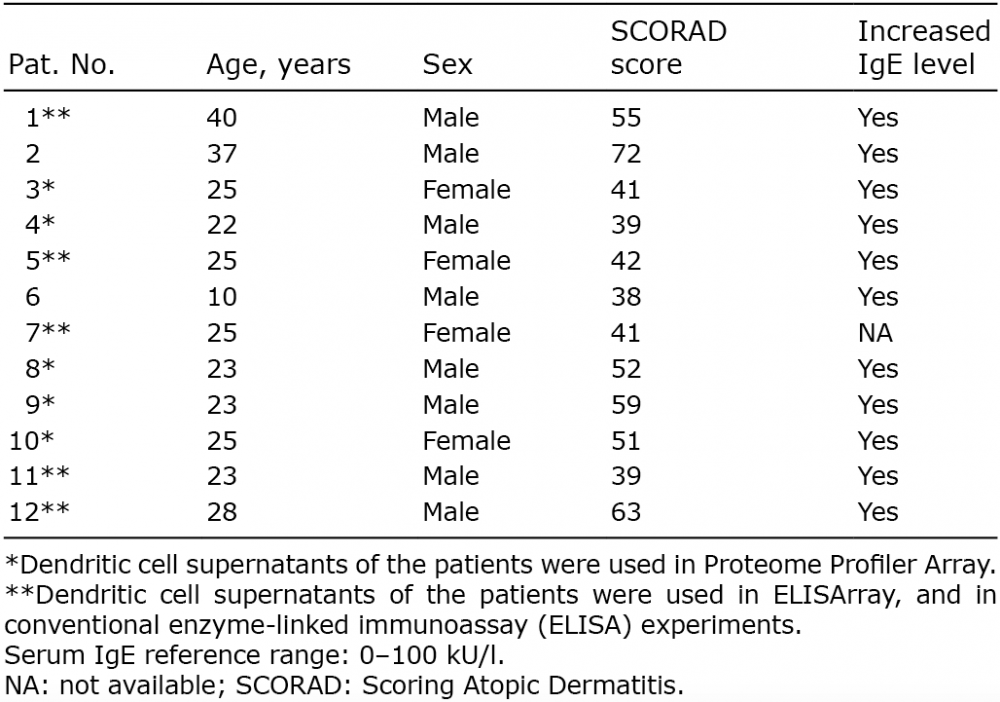
Peripheral blood was obtained from patients with chronic AD (n = 12, 8 males, 4 females, age: 25.5 ± 7.5 years, Table I) and buffy coat (n = 10) was used as the healthy controls. All patients fulfilled the diagnostic criteria established by Hanifin & Rajka (16). Patients who took part in this study had severe skin symptoms and had not been treated with oral glucocorticosteroids or other systemic immunomodulatory agents for at least 4 weeks, or with antihistamines or topical corticosteroids for at least 5 days, prior to blood sampling. Disease activities (mean ± SD) were determined by the severity Scoring of Atopic Dermatitis (SCORAD) index: 49.3 ± 11.1) and total serum IgE levels (2,598 ± 1,402 kU/l) were also determined. In all patients, hyper IgE syndrome (HIES) was excluded according to the HIES clinical scoring system (17). Informed consent was obtained from all participants according to the principles of the Declaration of Helsinki. The local ethics committee of the University of Debrecen, Hungary, approved the study.
Table I. Characteristics of patients with chronic atopic dermatitis
Peripheral blood mononuclear cells (PBMCs) were obtained by Ficoll-Paque Plus (GE Healthcare Bio-Science AB, Uppsala, Sweden) gradient centrifugation from the peripheral blood both of patients with AD and of healthy controls. CD1c+ myeloid DCs were isolated from PBMCs using the CD1c+ (BDCA1+) Dendritic Cell Isolation Kit (Miltenyi Biotech GmbH, Bergisch Gladbach, Germany) according to the manufacturer’s instructions. Purified DCs were cultured in RPMI 1640 (Miltenyi Biotech GmbH) medium supplemented with antibiotics (PAA Laboratories GmbH, Pasching, Austria) and 10% foetal bovine serum (FBS) (Lonza Group Ltd, Basel, Switzerland) for 48 h, in the presence (stimulated) or absence (unstimulated) of 30 ng/ml TSLP (eBioscience Inc., San Diego, CA, USA) and 100 ng/ml staphylococcal enterotoxin B (SEB) (Sigma Aldrich Co., St Louis, MO, USA). DCs (5–6 × 10⁵) were cultured in 200 μl cell culture medium in 1 or 2 wells of a 96-well flat-bottomed plate and supernatants were collected for chemokine examinations. Due to the relatively small number of cells available, flow-cytometry (FCS) analysis has not been performed with freshly isolated cells, but we performed preliminary experiments to exclude the possibility that cell culture could significantly modify the results of the cell surface marker examinations.
After incubation, the cells were harvested, washed in phosphate-buffered saline (PBS) with 5% FBS and 0.5 mM EDTA, and resuspended in FACS buffer (PBS containing 1% bovine serum albumin) and aliquoted into 4 wells of a 96-well plate (1 for the negative control, 1 isotype control, and 2 for staining). Cells were stained with the following dye-tagged cell-surface marker antibodies: APC-Cy7 anti-human CD1c and PerCP-Cy5.5 anti-human CD11c to identify CD1c+/CD11c+ cells, APC anti-human CD1a and APC anti-human CD207 to exclude LCs, and PE anti-human FcεRI, APC-Cy7 anti-human CD206, PerCP-Cy5.5 anti-human CD83 and PE anti-human CD86 to examine their characteristics, maturation and activation state. PE mouse IgG2b κ isotype control, APC mouse IgG1, κ isotype control, PerCP/Cy5.5 mouse IgG1, κ isotype control and APC/Cy7 mouse IgG1, κ isotype control were used as isotype controls. All the antibodies were from Biolegend, San Diego, CA, USA. Cells were stained for 30 min in the dark at 4°C. Stained cells were washed with FACS buffer and fixed by intracellular (IC) fixation buffer (eBioscience, San Diego, CA, USA) for 20 min in the dark at room temperature. After fixation, cells were washed and kept in FACS buffer at 4°C until measurement. The expression of cell surface markers was measured by flow cytometry.
Flow cytometric measurements were carried out on fixed cells in 96-well plates on a BD FACS Array instrument (Becton Dickinson, San Jose, CA, USA). Forward (FSC) and side-light scattering (SSC) was used to detect cellular objects and to exclude debris and clustered cells. PE-stained fluorescence was excited by a 532-nm laser and detected by a 585/42-nm band-pass filter; APC-stained samples were excited by a 635-nm laser and measured using a 660/20-nm filter; PerCP-Cy5.5-stained samples were excited by a 532-nm laser and measured using a 695/40-nm filter; and APC-Cy7-stained samples were excited by a 635-nm laser and measured using a 780/60-nm filter. Flow cytometric acquisition of 1 sample typically included 100,000–500,000 cells. Data was exported and evaluated using FCS Express 4 Flow Cytometry (De Novo Software, Los Angeles, CA, USA).
Chemokine production was measured using the Proteome Profiler Human Chemokine Array Kit (R&D Systems Abingdon, UK) from the cell culture supernatant of the previously isolated unstimulated cells (5 atopic and 5 control samples, marked in Table I). The assay was carried out according to the manufacturer’s instructions.
To validate our results, the production of CCL3, CCL4, CCL5, CXCL10, CCL17 and CCL22 chemokines were deteicted simultaneously from DC supernatants of 5 atopic and 5 control samples using the Human Common Chemokines Multi-Analyte ELISArray kit (Qiagen, Hilden, Germany). Since this ELISArray kit is a qualitative rather than a precise, quantitative assay, the exact amount of AD-related CCL17,CCL18 and CCL22 chemokines were also analysed using the CCL17/TARC, CCL18/PARC and CCL22/MDC Quantikine ELISA Kits (R&D Systems, Minneapolis, MN, USA), both according to the manufacturer’s instructions. In the case of the latter, conventional ELISAs the supernatants of both unstimulated and stimulated cells were investigated. The detection limits in Quantikine ELISAs are: CCL17: 7 pg/ml, CCL18: 1.7 pg/ml, and CCL22: 62.5 pg/ml.
SPSS ver. 18.0 software (SPSS Inc., Chicago, IL, USA) was used for statistical analysis. To assess the distribution of the data, the Kolmogorov–Smirnov test was used. Because of their normal distribution, we determined mean with corresponding 95% confidence interval or mean ± standard deviation (SD) values and used the independent t-test for statistical comparison of the experimental data. To analyse the homogeneity of variance of these data, F test was used. Differences were considered to be significant when p < 0.05.
Blood pre-dendritic cells from patients with atopic dermatitis express significantly more FcεRI and show tendentially altered presence of maturation markers
To examine the phenotypic features of the separated CD1c+ pre-DCs, and to exclude the non-relevant FACS-detected events, CD1c+/CD11c+ pre-DCs were gated, and thus more than 90% of the gated cells were positive for both the CD1c and the CD11c markers. The gated cells were negative for CD207 (Langerin-LC marker) and did not express CD1a (Fig. 1A).
Fig. 1. Identification of the chemokines produced by atopic dermatitis (AD) pre-dendritic cells (DCs) in comparison with the chemokine production of healthy pre-DCs. The supernatants of the isolated blood DCs were collected and the relative levels of chemokines were determined by a Proteome Profiler Array according to the manufacturer’s instructions. The relative levels of the AD- and control-related chemokines were determined by calculating the mean pixel densities of the individual blots normalized to the sample control. (A) Localization of the chemokine probes in the membranes (in duplicate). Numbers (1–20) and letters (A–G) indicate columns and rows that give the orientation of the probes. (B) Representative dot blots showing the relative expression of chemokines produced by control and atopic pre-DCs.
When examining the presence of the FcεRI, significantly higher expression of this receptor could be detected on the surface of AD pre-DCs compared with their healthy counterparts (58.7% vs. 29.8%, respectively, p = 0.004; Table II, Fig. S1B) and the difference was also significant in the case of stimulated cells (60.2% vs. 29.95%, respectively, p = 0.04, Table II). Detection of surface markers reflecting the activation and maturation state of the cells showed that the presence of these molecules tends to alter on DCs derived from patients with AD. The CD206 mannose receptor, which is known to be expressed on less mature cells, appeared on the surface of AD pre-DCs less frequently than on the surface of healthy pre-DCs (unstimulated: 48.6% vs. 64.8%, p = 0.536, stimulated: 38.47% vs. 54.42%, p = 0.116). The CD83 and CD86 markers exhibited an opposite expression pattern as they were expressed more frequently on AD patient-derived cells than on control cells (unstimulated: 63.0% vs. 57.9%, p = 0.96 and 83.4% vs. 74.5%, p = 0.12, respectively, Table II, Fig. S1B, stimulated: 68.66% vs. 50.15%, p = 0.18 and 90.63% vs. 84.5%, p = 0.22, respectively, Table II). Although none of the 3 examined surface markers showed significantly altered expression on AD DCs, their consistent and unidirectional changes suggest that most of the AD DCs are in a premature state.
Table II. Expression of cell surface markers on atopic dermatitis (AD) and control pre-dendritic cells (DC) ex vivo and after tissue-specific stimulation
Blood pre-dendritic cells from patients with atopic dermatitis are able to produce both atopic dermatitis-specific and maturation-related chemokines – screening of chemokine production by Proteome Profiler Array
The chemokine production potential of the AD DCs was examined with a screening method that can simultaneously detect the release of 31 different human chemokines. When investigating chemokine production using the Proteome Profiler Chemokine Array, the data revealed that chemokines released from AD pre-DCs could be separated into 2 groups (Figs 1 and 2). The first group included those chemokines that were detected in the supernatant of both the patient and the control pre-DCs in a similar amount: CXCL4, CXCL7, CXCL8 and CXCL16 (Fig. 2A). The second group included those chemokines that were produced at a significantly higher amount or solely by the AD pre-DCs: CCL3/4, CCL5, CCL17, CCL18, CCL19, CCL20, CCL22, CXCL1, CXCL5 and CXCL10 (p < 0.05 in the case of CCL3/4, CCL17, CCL22, CXCL1 and CXCL10; while in the case of CCL5, CCL18, CCL19, CCL20 and CXCL5 p > 0.05, not significant; Fig. 2B). From this group, CCL17, CCL18 and CCL22 are known as AD-related chemokines (Box 1, Fig. 2B), while CCL3, CCL4, CCL5 and CXCL10 can be defined as chemokines of maturing DCs (Box 2, Fig. 2B).
Fig. 2. Results obtained by the Proteome Profiler Chemokine Antibody Array. (A) Chemokines produced by both atopic dermatitis (AD) and control pre-dendritic cells (DCs) at similar levels. Columns represent the mean ± standard deviation (SD) of 5 patients and 5 controls. *p < 0.05. (B) Chemokines produced mainly or exclusively by AD pre-DCs. Columns show the mean ± SD of 5 patients and 5 controls. Chemokines in Box 1 are AD-related chemokines, while Box 2 represents the chemokines that are produced by DCs at an early maturation stage (according to the literature).
Re-evaluation of increased chemokine production by 2 different ELISAs
The production of the most important chemokines from the second group (the chemokines of maturing DCs such as CCL3, CCL4, CCL5, CXCL10 and the AD-related CCL17, CCL22) was also investigated by a Multi-Analyte ELISArray from the supernatant of unstimulated cells. CCL3 and CCL4 could be detected in a significantly higher amount in the samples of AD pre-DCs compared with controls (Fig. 3A), similar to that observed during our investigations using the Proteome Profiler Chemokine Array (CCL3 meanod450: 1.77 ± 0.36 vs. 0.15 ± 0.01, respectively, p = 0.0098 and CCL4 meanod450: 1.28 ± 0.41 vs. 0.26 ± 0.11, respectively, p = 0.0498). Regarding CCL17, CCL22 and CCL5, we could not detect significant differences between the 2 groups (CCL17 meanOD450: 0.25 ± 0.14 and 0.124 ± 0.10 in atopic vs. control samples; p = 0.47; CCL22 meanOD450: 2.37 ± 0.1 and 1.74 ± 1.2 in atopic vs. control samples; p = 0.48; CCL5 meanOD450: 0.225 ± 0.3788 and 0.0342 ± 0.04 in atopic vs. control samples, p = 0.458; Fig. 3A), which may be due either to the different sensitivity levels of the 2 methods or to the high SD of the samples. In AD samples CXCL10 could be detected at a low level, but it could not be detected in the supernatant of control cells at all (data not shown).
Fig. 3. Validation of the production of the atopic dermatitis (AD)-specific and maturation-related chemokines by enzyme-linked immunoassay (ELISA). (A) From the supernatants of 5 AD and 5 control pre-dendritic cell (DC) samples the most important chemokines (chemokines representing early maturation stage: CCL3, CCL4, CCL5; AD-related chemokines: CCL17, CCL22) were also investigated by ELISArray. AD pre-DCs produced CCL3 and CCL4 in significantly higher amounts than the control cells, similar to that observed during our investigations using the Proteome Profiler Chemokine Array, but regarding CCL5, CCL17 and CCL22 significant differences could not be detected with this method. (B–D) Examination of AD-related chemokines by conventional ELISA. AD pre-DCs are able to produce CCL17 and CCL22 in a significantly higher amount than control DC after tissue-specific stimulation (thymic stromal lymphopoietin (TSLP) + Staphylococcus enterotoxin B (SEB)). In addition, they have the potential to produce CCL18 with or even without any stimulation. Columns represent the mean ± standard deviation (SD) of 5 patients and 5 controls. *p < 0.05. **p < 0.01.
In the case of the 2 AD-related cytokines (CCL17 and CCL22) together with CCL18, more precise and reliable conventional ELISA investigations were also carried out, investigating both unstimulated and stimulated pre-DC supernatants. With conventional ELISA we could detect that unstimulated AD DCs are able to produce both CCL17 and CCL22 in higher amounts than the control cells, but the differences between the 2 groups became statistically significant after AD-specific stimulation (Fig. 3B and C). CCL18 could be detected in a significantly higher amount in the supernatant of atopic DCs, both with and without any further stimulation (mean: 810 pg/ml vs. 84.1 pg/ml, respectively, p = 0.006 when examining unstimulated, or mean: 915.5 pg/ml vs. 280.14 pg/ml, respectively, p = 0.01 in the case of stimulated cells) (Fig. 3D).
This study focused on the phenotypic characteristics and chemokine production of the poorly investigated CD1c+ blood pre-DCs of patients with AD. These cells are thought to be the precursors of skin dermal DCs (11, 12), and they may also serve as the precursors of skin inflammatory DCs (11). Investigating blood pre-DCs can give information on when or where skin myeloid DCs acquire their AD-specific characteristics, i.e. exclusively in the skin microenvironment or even in the blood if they are already influenced by some disease-specific factors. These questions can be answered only by examining DCs directly separated from peripheral blood, instead of applying DCs that have been differentiated in vitro from monocytes, and although this method results in fewer cells from the same amount of blood, their characteristics more closely resemble the physiological conditions.
The expression of FcεRI on DCs in AD skin was studied almost 20 years ago (18, 19). Their surface expression shows high levels both on LCs and IDECs and they are suggested to regulate inflammatory processes (20). Our own results showed a significantly elevated level of these receptors on blood pre-DCs, confirming previous literature data (21, 22). The higher numbers of this receptor on the surface of blood CD1c+ precursor cells may be the result of elevated serum IgE levels in patients with AD. Blood DCs can use this receptor for IgE-mediated allergen presentation (22); moreover, the presence of specific IgE and the receptor on their surface increases the efficiency of antigen uptake and presentation after arriving to the skin (20, 23).
Based on the expression of the CD206 marker (mannose receptor), immature and mature DCs can be distinguished, since most of the mature DCs do not express this protein on their surface in high amounts (24–26). We detected this marker in both the diseased and the control groups, but fewer AD pre-DCs tended to express them, suggesting a premature state of DCs in AD. With respect to the expression of the CD83 and CD86 maturation and activation markers on the surface of blood DCs, the literature is controversial (21, 23). Our results suggest higher expression of these markers on the pre-DCs of patients with AD, and although neither CD206 nor CD83/CD86 showed significantly altered expression (even after stimulation) on DCs from patients with AD, their consistent and unidirectional change may suggest that AD pre-DCs are in a premature state. The lack of significance in our present results and the inconsistency in the data in the literature related to these maturation markers can be explained by a recent observation that it is likely that not the entire blood CD1c+ population, but rather a subpopulation, is in a premature state (15). In that study a greater population of more active and larger DCs with decondensed nuclei and with low DAPI intensity was identified in the blood of patients with AD, and the AD characteristic cytokine production was also assigned to these cells (15).
The current study also investigated the chemokine production of AD pre-DCs, since DCs are important sources of chemokines, and there is insufficient information on the chemokine production of these cells in the blood of patients with AD. First we applied a Proteome Profile Chemokine Array to screen the most important chemokines produced by AD pre-DCs ex vivo, then we tried to confirm our results by an ELISArray. Furthermore, we were also interested in the stimulatory effect of the tissue-specific microenvironment, so we compared the chemokine-producing capacity of unstimulated cells (representing blood pre-DCs) and DCs after stimulation with TSLP and SEB using more precise conventional sandwich ELISA.
According to our results from the Proteome Profiler Array the chemokines were divided into 2 groups: (i) chemokines that were produced by AD and control pre-DCs in a similar amount; (ii) chemokines produced in a higher amount by AD pre-DCs. In the first group, both AD and healthy pre-DCs produced CXCL4, CXCL7, CXCL8 and CXCL16 in similarly high amounts suggesting that their production is characteristic of blood pre-DCs, but independent of the presence of AD.
The members of the second group (CCL3, CCL4, CCL5, CCL17, CCL18 and CCL22, except for CXCL10) were found to be released in higher amounts by blood pre-DCs of patients with AD (detected both by Proteome Profiler Array and ELISAs). Among them CCL17, CCL18 and CCL22 are considered to be AD-related chemokines that are also produced by skin DCs of patients with AD, and have an important role in regulating the Th2 immune response and also play a role in the trafficking of memory T cells (3, 23, 26). Gene expression of the inflammation-related CXCL10, CCL3, CCL4 and CCL5 were detected not only in the skin of patients with AD, but also in the skin of patients with other inflammatory skin diseases (14), indicating that the elevated level of these chemokines is a general characteristic of chronic inflammation, rather than an AD-specific factor.
The chemokine production pattern of blood DCs in patients with AD described above can also give some information on their maturation, since DCs at different maturation stages produce different combinations of chemokines (27–30). Premature DCs that show early signs of maturation start to produce CCL2, CCL3, CCL4, CCL5, CXCL8 and CXCL10 in high amounts (27–30). In our study the production of CCL3, CCL4, CCL5 and CXCL10 inflammatory chemokines mainly by AD pre-DCs, further confirmed their premature status.
Taken together, the characterization of cell surface markers and the chemokine production of blood pre-DCs in patients with AD indicate that these cells are in a premature stage, and are able to produce AD-specific chemokines even in the peripheral blood. Considering this AD-specific chemokine production and our earlier finding on their capacity to release AD-specific cytokines, we suggest that development of AD DCs are markedly influenced by the microenvironment in the blood and not just by the skin milieu. However, their chemokine and cytokine profile becomes more intense and disease-specific after tissue-specific stimulation. The bloodstream of patients with AD contains unique sets of cytokines, such as IL-4, IL10, IL-13, CCL17 (TARC) and TSLP (31–38), which can allow these cells to reach the early stage of maturation. Novel biological therapies (e.g. Dupilimab or anti-TSLP monoclonal antibodies) used against these molecules can have a doubly beneficial impact by modifying the effect of these cytokines both in the skin and in the blood of patients with AD, thus influencing the maturation and the function of the precursor DCs in the blood (39, 40).
This research was supported by the European Union and the State of Hungary, co-financed by the European Social Fund in the framework of TÁMOP-4.2.4.A/ 2-11/1-2012-0001 “National Excellence Program”. Members of the research group, the research infrastructure and the purchase of equipment were supported by Hungarian Research Grants (OTKA-K108421, OTKA-PD112077, University of Debrecen RH-885/2013) and Támop-4.2.2.A-11/1/KONV-2012-0023 “DEFENSE-NET”.
The authors declare no conflicts of interest.


 Click to show fullsize
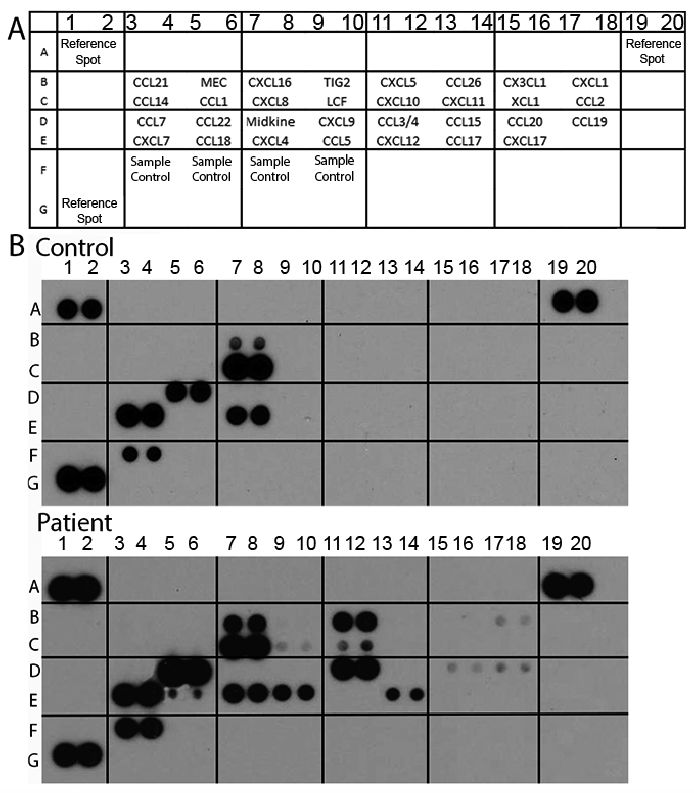 Click to show fullsize
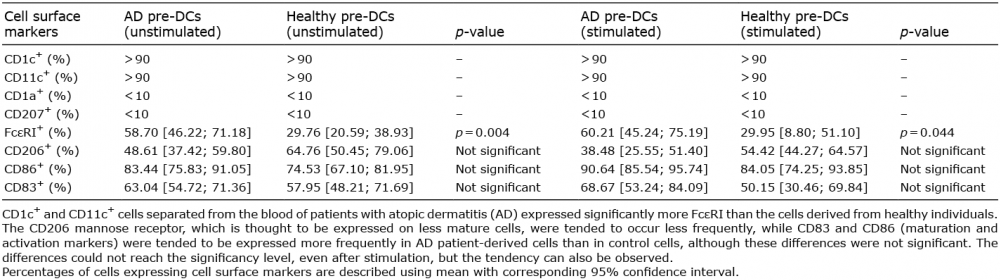 Click to show fullsize
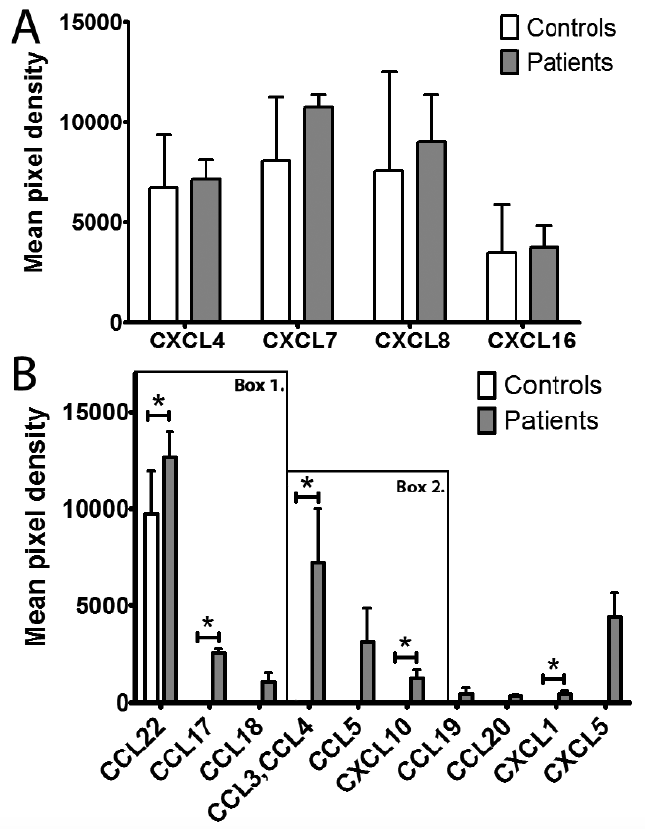 Click to show fullsize
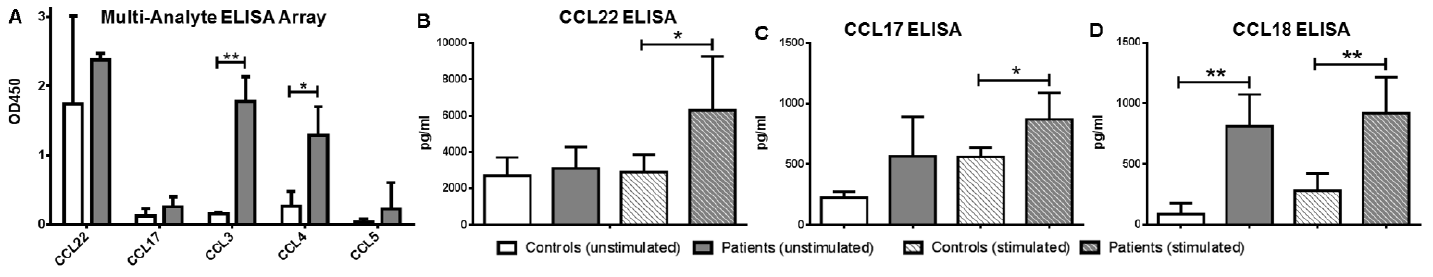 Click to show fullsize