


1Department of Dermatology, 3Department of Pathology, Hospital Clínico Universitario, and 2School of Medicine, University of Valencia, Valencia, Spain
The aim of this study was to determine the clinical, histological and/or immunohistochemical features that enable differential diagnosis of regression of melanocytic naevi from regression of melanomas. All melanocytic neoplasms with histologically-confirmed regression diagnosed in our hospital between 2002 and 2009 were reviewed retrospectively. Lamellar and delicate fibrosis were associated with melanocytic naevi (p < 0.0001 and p = 0.021, respectively). Compact fibrosis, high vessel density and higher number of granzyme B+ lymphocytes were associated with malignant melanoma (p = 0.011, p = 0.005 and p = 0.013, respectively). Density of inflammatory infiltrate (p = 0.016), vascular proliferation (p = 0.005), epidermal atrophy (p = 0.009), rate of apoptosis (p = 0.046) and granzyme B immunoreactivity (p = 0.013) was more common in severe–dysplastic naevi and melanomas than in the remaining melanocytic naevi. Logistic regression demonstrates that 5 variables (age, lamellar fibrosis, melanophages, vessel density, and granzyme B immunostaining) would serve to classify appropriately 87% of melanomas among melanocytic lesions with complete regression.
Key words: melanocytic naevi; melanoma; regression.
Accepted Feb 20, 2017; Epub ahead of print Feb 22, 2017
Acta Derm Venereol 2017; 97: xx–xx.
Corr: José M. Martín, Servicio de Dermatología, Hospital Clínico Universitario, Avda. Blasco Ibáñez 17, ES-46010 Valencia, Spain. E-mail: Martin.josemaria@gmail.com
Melanoma and melanocytic naevi are among the group of tumours most able to stimulate an immune response. In fact, regression of melanoma is 6 times more frequent than in other malignant neoplasms (1), and while histologically-confirmed complete regression of melanomas is exceptional, partial regression occurs in 10–35% of cases (2).
Several mechanisms are potentially involved in the induction of regression, although an immune mechanism seems to be most consistently associated with this process (2–4).
The essential feature of a melanoma undergoing spontaneous regression is the replacement of tumour cells by a fibrous stroma with varying degrees of inflammation and new blood vessel formation, as well as varying numbers of melanophages, similar to the changes seen in regression of melanocytic naevi (2, 5, 6). From an exclusively histological perspective, it is very difficult to determine the malignant or benign nature of a lesion after complete regression and, in most cases, only the detection of metastasis during clinical follow-up allows this distinction to be made with certainty.
This study attempted to identify clinical, histological and immunohistochemical features that could be helpful in differentiating regression of benign melanocytic lesions from that of melanomas.
This study retrospectively evaluated a variety of clinical, histopathological and immunohistological characteristics of all melanocytic neoplasms with histological regression diagnosed in our hospital over an 8-year period (from 1 January 2002 to 31 December 2009). The specimens were identified from a histological database using the keywords “regression”, “melanocytic naevi” and “melanoma”.
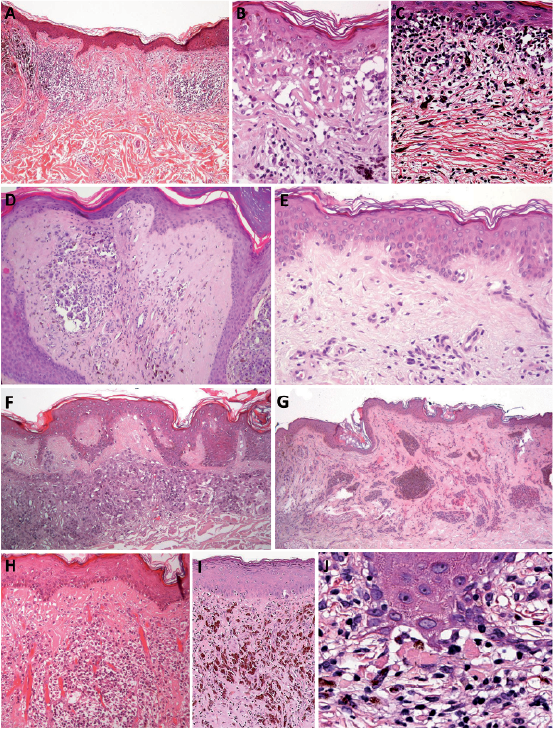
Regression was accepted when replacement of tumour cells by a fibrous stroma with varying degrees of inflammation, as well as new blood vessel formation and varying numbers of melanophages, were present (Fig. 1). None of the lesions evaluated were associated with previous inflammatory or infectious reactions, or previous treatments that could justify the development of regression.
Fig. 1. Histopathological features of regression. (A) Reduction in the number of melanocytic cells and presence of lymphocytic inflammatory infiltrate, melanophages, vascular proliferation, dermal fibrosis and epidermal atrophy. Lamellar fibrosis mainly present in (B) the papillary dermis and (C) the upper reticular dermis. (D) Malignant melanoma with compact fibrosis. (E) Delicate fibrosis, characterized by very thin collagen fibre bundles. (F) Subepidermal fibrosis. (G) Florid fibroplasia with thick homogeneous collagen bundles forming a horizontally oriented, plaque-like configuration. (H) New vessels perpendicular to the epidermis: (I) numerous melanophages in the upper half of the lesion. (J) Dermo-epidermal nest of apoptotic melanocytes with satellite lymphocytes. Hematoxylin-eosin: A: × 40; B, C, E, H, I: × 200; D, F: ×100; G: ×20; J: ×400.
The study included a total of 163 tumour samples: 39 non-dysplastic melanocytic naevi, 77 dysplastic naevi, and 47 primary cutaneous melanomas (31 superficial spreading melanomas, 11 lentigo maligna, 2 acral lentiginous melanomas, 2 nodular melanomas, and 1 unclassifiable melanoma).
All samples were fixed in 4% neutral formaldehyde. After embedding in paraffin, 3-µm thick sections were cut and stained with haematoxylin and eosin. To evaluate immunohistochemistry, 6 tissue microarrays (TMA) were built using the MTA-1 (Manual Tissue Arrayer, Beecher Instruments, Inc., Sun Prairie, WI, USA). The most representative areas of each slide were selected for evaluation, especially those with prominent inflammatory infiltrate, and assembled in a new paraffin block.
The following variables were recorded for analysis: (i) Clinical data: patient age and sex, location of lesion; (ii) Histological data: diagnosis (melanoma, severe-dysplastic naevi, mild-dysplastic naevi, non-dysplastic naevi); fibrosis: extent (slight, moderate, extensive), type (lamellar, compact, delicate, florid or indeterminate), and location (subepidermal accentuation); mononuclear inflammatory infiltrate: density, type (patched or diffuse) and location (intratumoural or peritumoural); melanophages (density); blood vessel formation (density); tumour cell apoptosis (none, slight, intense); melanocytic loss, (slight, moderate, extensive, total); and epidermal atrophy (present or absent); and (iii) Immunohistochemical data: immunostaining of lymphocytes was performed with 6 commercial antibodies to CD4 (clone 1F6; Novocastra), CD8 (clone 1A5; Novocastra), CD25 (clone 4C9; Novocastra), FoxP3 (clone 236A/E7; Abcam), and granzyme B (clone GrB-7; Dako).
A simplification of dysplastic naevi into high and low grades of cytological atypia was made according to other authors (7–9). Severe atypia was considered based on the following criteria: nuclear size 2 times or greater than the keratinocyte nucleus, severe nuclear pleomorphism, vesicular chromatin, prominent and enlarged nucleolus and abundant cytoplasm (9). Quantitative assessments (density of lymphocytes, melanophages and vessels) were evaluated using a 40× objective, counting the maximum number of cells per high-power field (HPF). For this purpose, the whole slide was reviewed in every case and we selected the most representative areas for each analysed parameter. Qualitative assessments were based on semiquantitative scales, studied as follows: extent of fibrosis and melanocyte loss (slight, present in up to one-third of the horizontal tumour area; moderate, present in up to two-thirds of the area; and extensive, involving two-thirds of the area or more); apoptotic melanocytes (absent; moderate, ≤ 2 apoptotic cells per HPF; intense, > 2 apoptotic tumour cells per HPF).
Types of fibrosis: lamellar (thin collagen bundles forming parallel lamellae with fibroblasts in a linear pattern between); compact (eosinophilic and dense acellular fibroplasia); delicate (extremely thin, randomly arranged collagen bundles, and with very little cellularity); florid fibroplasia (wavy exaggerated fibroplasia forming a horizontally oriented, plaque-like configuration); and indeterminate (fibrosis not classifiable as any one of the previous types). Subepidermal fibrosis was considered when a well-defined band of collagen was present just below the epidermal basement membrane (Fig. 1).
Two experienced individuals; a pathologist and a dermatologist (CM and JMM, respectively) simultaneously reviewed the histopathological slides of all cases using a multiheaded microscope blind to clinical information.
Immunoreactivity was considered positive when nuclear (FoxP3) or cytoplasmic/membrane (CD4, CD8, CD25 and granzyme B) staining was present (Fig. 2). The maximum number of positive cells per HPF was counted.
Fig. 2. Positive cytoplasmic membrane immunostaining of lymphocytes for CD8 (A), CD 25 (B), and granzime B (D). Positive nuclear immunostaing of lymphcytes for FoxP3 (C).
A: ×400; B, D: ×200; C: ×100.
Data were analysed using SPSS for Windows®, version 18. The χ2 test was used for qualitative variables, applying the Fisher’s exact test when 20% or more of the expected values were < 5. Student’s t-test was used to compare the means of 2 independent groups, and the analysis of variance (ANOVA) if the qualitative variable included 3 or more categories. The non-parametric Mann-Whitney U-test and Kruskal-Wallis test were used when variables did not comply with normal criteria. Quantitative variables are presented as mean ± standard deviation (SD), whereas qualitative variables are presented as absolute frequency and percentage. Statistical significance at the 95% confidence interval (95% CI) was accepted. Binary logistic regression was carried out using the forward and backward step-wise method. Inclusion and exclusion criteria of variables in models were performed using the likelihood ratio test, inclusion criterion p ≤ 0.05 and exclusion criterion p > 0.10. From the regression model obtained, a receiver-operating characteristic (ROC) curve was calculated to assess the power of this model in predicting melanoma diagnosis.
We identified 116 of 8,898 excised melanocytic naevi (1.30%; 95% CI: 1.1–1.5), and 47 of 433 malignant melanomas (10.85%; 95% CI: 7.9–13.8) by keyword searching, as described.
The mean age of the patients was 47.1 ± 20.1 years (range 3–87 years). The mean age of the women was 44.0 ± 19.6 years, and 49.5 ± 20.3 years in men. The mean age of the patients with non-dysplastic naevi was 37.7 ± 19.9 years, patients with melanomas 60.3 ± 15.5 years, patients with mild-dysplastic naevi 44.0 ± 19.9 years, and patients with severe-dysplastic naevi 43.5 ± 16.8 years (p < 0.0001).
Distribution by sex was almost even in patients with non-dysplastic naevi (51.3% women and 48.7% males), although dysplastic naevi and melanomas were more frequent in males (58.4% and 59.6%, respectively; p = 0.53). There was no correlation between regression features and sex.
The differences relating to location of the distinct types of melanocytic lesions were statistically significant (p = 0.027). The most frequent location in all types of lesions was the back, although this site was less common in melanomas (36.1%) than in the remaining lesions (52.5%).
Table I summarizes the histological findings.
Table I. Summary of the histological parameters
Lamellar fibrosis was found in 84.6% of non-dysplastic and mild-dysplastic naevi, in 76% of severe-dysplastic naevi, and in only 46.8% of melanomas (p < 0.0001). In contrast, compact fibrosis predominated in melanomas (40.4%), and was found in only 15.3% of non-dysplastic and mild-dysplastic naevi, and in 20% of severe-dysplastic naevi (p = 0.011). Delicate fibrosis was exclusively present in non-dysplastic melanocytic naevi (7.7%; p = 0.021). Indeterminate fibrosis was almost exclusively found in melanomas (12.7%; p = 0.006). Subepidermal fibrosis was 7 times less frequent in severe-dysplastic naevi than in mild-dysplastic naevi (p = 0.013).
Melanophage density was very high in melanomas in comparison with the remaining lesions. Vessel density correlated with the degree of dysplasia of the lesions, and was highest in melanoma (p = 0.005). Apoptosis was lower in non-dysplastic naevi in comparison with the remaining lesions (p = 0.046). Epidermal atrophy was more common in severe-dysplastic naevi and melanomas (p = 0.009).
Table II summarizes the immunohistological findings.
Table II. Summary of the immunohistochemical results for CD4, CD8, FoxP3, CD25, and Granzyme B
The number of granzyme B+ cells correlated with the degree of atypia (p = 0.013). CD4+ T cells were more numerous than CD8+ cells in all types of melanocytic lesions. In melanocytic naevi, the density of CD8+ T lymphocytes correlated with the histological increase in dysplasia.
Lymphocyte immunostaining with FoxP3 was higher in melanomas than in melanocytic naevi, and also more abundant in dysplastic naevi than in non-dysplastic naevi, although these differences were not statistically significant. CD25 immunostaining presented greater similarity between the different types of melanocytic lesions.
Table III presents the logistic regression analysis associated with melanoma diagnosis, and Fig. 3 shows the ROC curve obtained from the logistic regression model.
Table III. Results of multiple logistic regression analysis to predict melanoma diagnosis
Fig. 3. Receiver-operating characteristic (ROC) curve to predict melanoma diagnosis. Area under ROC curve: 0.870 (95% CI: 0.811–0.929). p < 0.0001. Typical error under non-parametric suppose 0.030.
This curve indicates that the prediction model, which includes 5 variables (age, lamellar fibrosis, melanophages, vessel density, and granzyme B immunostaining), would correctly classify 87% (95% CI: 81.1–92.9) of melanoma lesions with complete regression.
This study found several differential features related to the regression of malignant melanomas and melanocytic naevi. With regard to clinical variables, in patients with melanoma, the mean age was 17 years higher than in patients with dysplastic naevi, and 23 years higher than in patients with non-dysplastic naevi. Male sex has been found to increase the risk of having multiple melanocytic naevi and melanoma in some studies (10, 11). In our series, dysplastic naevi and melanomas with regression were more frequent in males (58.4% and 59.6%, respectively), although the differences did not reach statistical significance.
Melanocytic lesions with regression present several changes related with the immune attack (“active or destructive phase”), such as lymphocytic infiltration, apoptosis or melanophages; and with tissue repair (“late or reparative phase”), such as angiogenesis, fibrosis or epidermal atrophy (2, 6, 12, 13).
In our series, the density of the inflammatory infiltrate was higher in severe-dysplastic naevi and melanomas. Immunophenotypic characterization of the cells found in the inflammatory infiltrates demonstrates that CD4+ T lymphocytes are predominant in all types of melanocytic lesions though CD8+ T-cell density in melanocytic naevi correlates in our series with the degree of dysplasia. Moreover, a progressive increase in granzyme B+ cells also correlated with the degree of atypia. With regard to tumour infiltrating lymphocytes, which express FoxP3, a marker for regulatory T cells (Tregs), which may favour melanoma progression (14, 15), we found the highest density in melanomas. Moreover, it was also higher in dysplastic naevi compared with non-dysplastic naevi.
The highest rate of apoptosis was also found in melanoma, although it was only 5.4% higher than that of severe-dysplastic naevi.
Regression in melanoma is also associated with intense melanophagia. In fact, nodular melanosis (presence of numerous melanophages) is considered an essential finding in histological regression of melanomas (1, 16). In our series, melanophage density was much higher in melanomas than in melanocytic naevi, and melanophagia was one of the parameters found by multivariate analysis to be among the most powerful in distinguishing between naevi and melanoma.
These lesions also show collagen alterations due to the host stromal response. As shown in this study, in regression areas, several (sometimes mixed) types of collagen alterations can be found. In contrast to suggestions by other authors (17, 18), there were no significant differences in the extent of fibrosis between the different types of melanocytic lesions. However, the type of fibrosis did seem to correlate with the degree of histological atypia. Lamellar fibrosis is a common finding in melanocytic naevi with regression, and was shown by the multivariate analysis to be the most useful feature for differentiating melanocytic naevi from melanoma, in that absence of lamellar fibrosis would support melanoma diagnosis. In addition, subepidermal location of fibrosis could be helpful in differentiating between melanoma with regression (23.4%) and severe-dysplastic naevi with regression (5.1%; p = 0.013).
New vessel formation increased correlating with the degree of dysplasia of the lesions. It is an essential feature for both melanoma progression and regression, and some authors have reported higher microvascular density in the late stage of regression compared with non-regressive areas (internal control) of regressive melanomas (19, 20).
Epidermal atrophy has been found, particularly in severe-dysplastic melanocytic naevi and in melanomas. In dysplastic naevi with regression it could help to differentiate between severe- and mild-grade dysplastic naevi (found in 60% and 26.9%, respectively).
Explanations for regression within melanocytic tumours have largely focused on immunological mechanisms, and the histological finding of numerous lymphocytes is thought to be indicative of such mechanism (1). Moreover, the presence of tumour-specific cytotoxic T cells in the peripheral blood and lymph nodes of melanoma patients has also been well established.
The biological significance of regression in melanoma has been much debated in the literature. Although, in some cases, the immune response may facilitate the selection of the more aggressive clones (14, 15, 20–23), most recent studies tend to consider regression to be a protective mechanism (2, 21, 24).
Various tumour antigens expressed in melanomas are recognized by cytotoxic T lymphocytes (21–23). The most frequently detected group of antigens in patients with melanoma (and the most immunogenic) are melanocytic differentiation antigens, such as Melan-A/MART-1 (the most common), gp 100, and tyrosinase (25). The genes encoding these antigens are expressed not only in melanomas, but also in normal melanocytes (26). The fact that multiple primary malignant melanomas arising in the same patient are not clonal in origin suggests that other tumour-associated antigens are unique for each primary melanoma and might not contribute to an immune response activation (4, 27).
Finally, these findings of similar features of regression between severe dysplastic naevi and melanomas (density of inflammatory infiltrate (p = 0.016), vascular proliferation (p = 0.005), epidermal atrophy (p = 0.009), rate of apoptosis (p = 0.046) or granzyme B immunoreactivity p = 0.013)) support the concept that severe dysplastic naevi are closer to melanomas than to mild-dysplastic naevi (28, 29).
In cases with complete regression of a melanocytic lesion, absence of lamellar fibrosis, together with a high density of melanophages, blood vessels, and granzyme B+ lymphocytes, as well as an increasing age of the patient would support a diagnosis of melanoma.
Using the equation obtained from the final logistic model, the probability of correctly diagnosing melanoma in a completely regressed lesion would be between 81.1% and 92.9%.
This study was supported by grants PROMETEO II/2015/009 from Generalitat Valenciana, Spain; PI13/02786 from Instituto de Salud Carlos III, Spain; and FEDER European funds.
The authors declare no conflicts of interest.


 Click to show fullsize
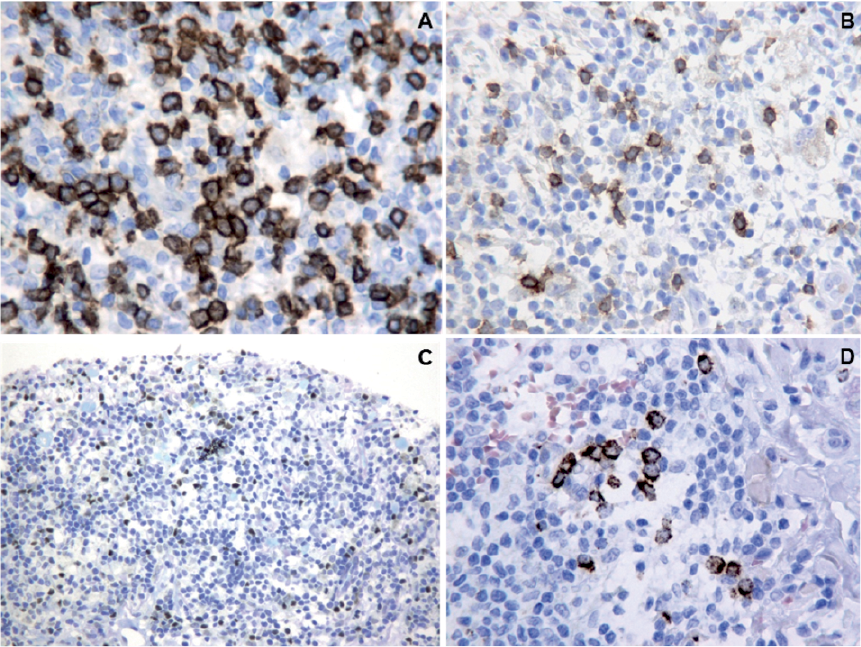 Click to show fullsize
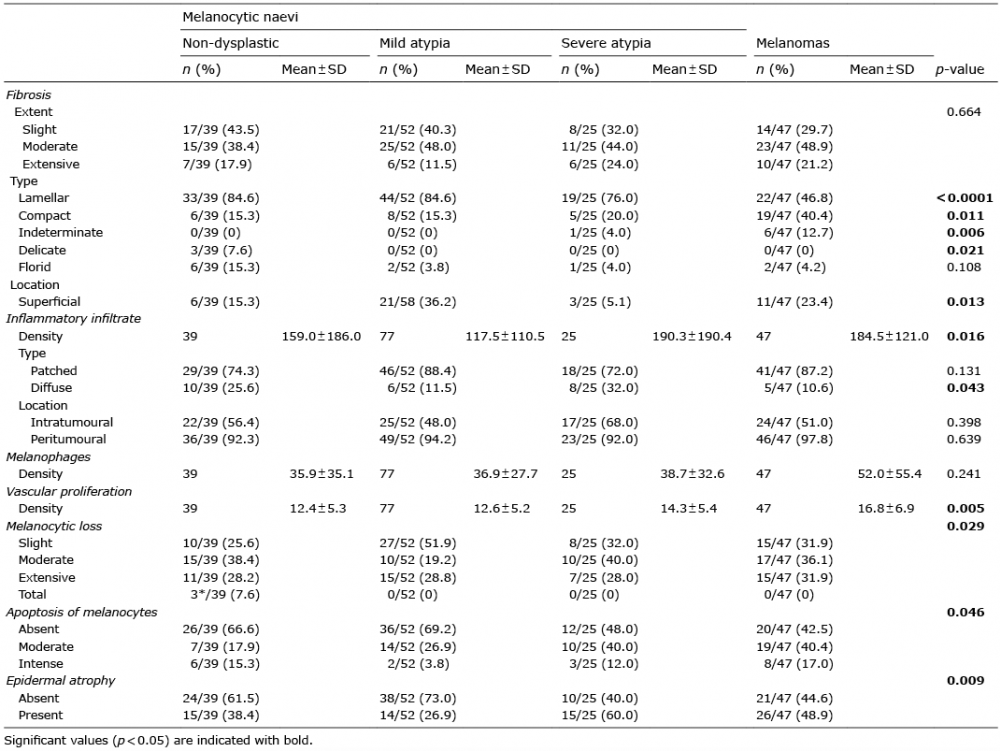 Click to show fullsize
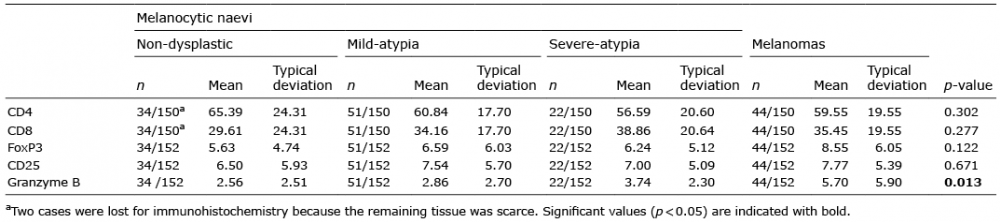 Click to show fullsize
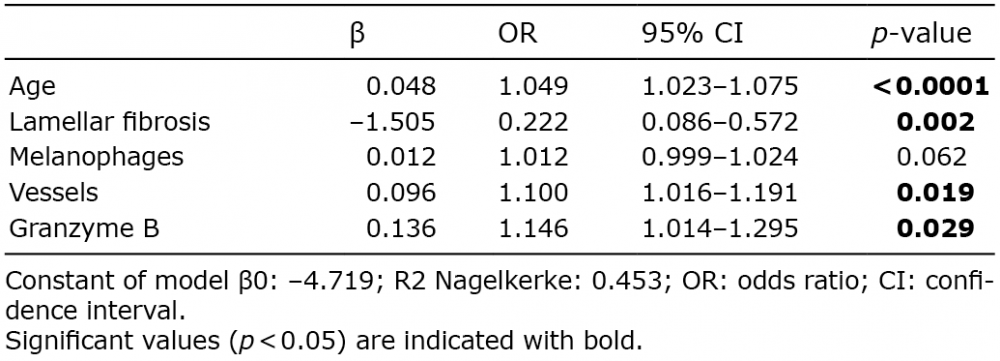 Click to show fullsize
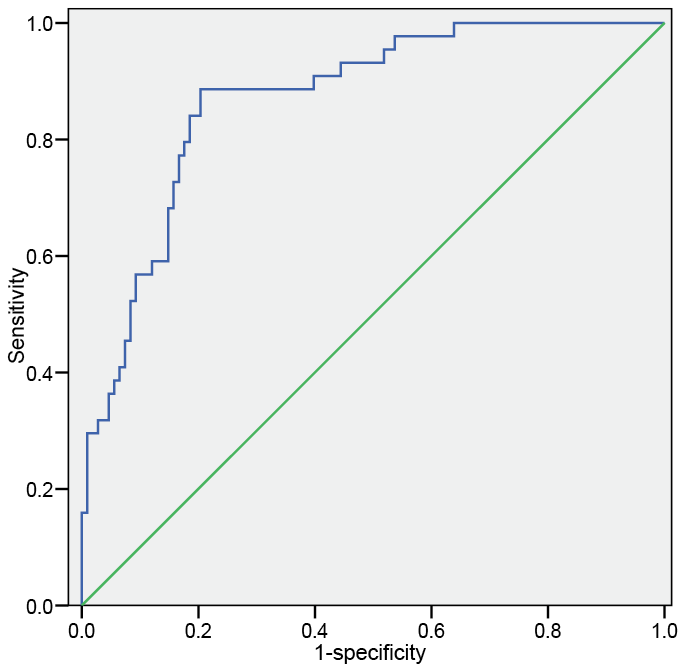 Click to show fullsize