Bryan J. Moreton, PhD, David A. Walsh, FRCP, PhD, Katie V. Turner, MSc and
Nadina B. Lincoln, PhD
From the Arthritis Research UK Pain Centre, University of Nottingham, Nottingham, UK
OBJECTIVE: To examine the measurement properties of the Chronic Pain Acceptance Questionnaire Revised (CPAQ-R) and its subscales with people with knee osteoarthritis using Rasch analysis.
DESIGN: Cross-sectional questionnaire study.
Patients: A total of 176 participants with radiographic evidence of osteoarthritis of the knee, as identified by a Kellgren-Lawrence grade ≥ 2, and pain on most days for at least the past month.
METHODS: Participants completed the CPAQ-R at home within a set of measures covering different aspects of osteoarthritis pain. The questionnaires were returned by pre-paid envelope. Rasch analysis was conducted on the Activity Engagement and Pain Willingness subscales and the Total scale using Rasch Unidimensional Measurement Models (RUMM2020).
RESULTS: The Activity Engagement and Pain Willingness subscales fit the Rasch model following minimal changes, including re-scoring and removal of item 14 due to misfit. Both subscales passed tests of unidimensionality. Although the Total scale could be adjusted to yield adequate fit statistics, it demonstrated multidimensionality.
CONCLUSION: The Activity Engagement and Pain Willingness subscales have good measurement properties for 2 distinct factors relevant to pain acceptance. CPAQ-R is a valid measurement tool that may help target and evaluate response to treatments that address low activity engagement and pain willingness in people with osteoarthritis.
Key words: Rasch analysis; osteoarthritis; chronic pain; acceptance; outcome assessment.
J Rehabil Med 2015; 47: 655–661
Correspondence address: Nadina Lincoln, Division of Rehabilitation and Ageing, School of Medicine, University of Nottingham, Medical School, Queen’s Medical Centre, Nottingham NG8 1BB, UK. E-mail: nadina.lincoln@nottingham.ac.uk
Accepted Mar 17, 2015; Epub ahead of print Jun 1, 2015
INTRODUCTION
Pain acceptance is of interest as a potential rehabilitation target for people with musculoskeletal pain and can be addressed by psychological interventions (1–3). Acceptance is the ability to embrace pain without trying to alter it (4, 5). However, acceptance has rarely been evaluated specifically in people with osteoarthritis (OA), despite evidence to suggest that it may be an important component of the pain experience in this condition (6). Acceptance may moderate the relationship between negative affect and pain severity in OA, and higher acceptance has been associated with less negative affect in those with severe pain (7, 8).
The Chronic Pain Acceptance Questionnaire Revised (CPAQ-R) is one of the most widely used measures of acceptance (9, 10). It is composed of 20 items; 11 items assess Activity Engagement (AE) and the remaining 9 items measure Pain Willingness (PW). The former dimension was conceptualized as the ability to continue with typical life activities despite pain, while the latter dimension referred to willingness to experience pain. Studies examining the dimensional structure of the CPAQ-R have reported some inconsistent results. Nicholas & Asghari (11) found evidence of 4 factors when conducting a principal components analysis (PCA) of responses provided by chronic pain patients. However, confirmatory factor analytic studies, with CPAQ-R data from patients with chronic pain, have produced acceptable fit indices for the 2-factor solution following minimal modifications (12, 13). Furthermore, psychometric data from studies using different language translations of the questionnaire have supported the 2-factor model (14–19).
Despite the widespread use of the CPAQ-R with people with different conditions (2, 20–22), and its high correspondence to problems reported by people with knee OA (6), it has not been Rasch analysed (23). Rasch analysis would be beneficial because it provides a strict test of unidimensionality (24–26), which would permit evaluation of the dimensional structure of the 2 proposed factors. Furthermore, given fit to the Rasch model, one can transform raw questionnaire scores to interval level data, thereby facilitating the use of parametric statistics and analysis of change data. Finally, Rasch analysis is an integrated evaluative approach to the assessment of questionnaires allowing for an examination of many important measurement properties. Therefore the aim of the study was to explore the fit between data obtained from the CPAQ-R and the Rasch model, including unidimensionality, response thresholds, and invariance of items.
METHODS
Participants
Potential participants were identified from a group of people who had participated in previous research (27), and through clinics at Nottingham University Hospitals and Sherwood Forest Hospitals NHS Trusts. Participants were included in the study if they had OA of the knee graded ≥ 2 using Kellgren and Lawrence criteria (28) and felt pain from their affected joint on most days for at least the past month. Exclusion criteria were: people who did not speak or understand English, had had knee joint surgery within the past 3 months or had another form of arthritis (e.g. rheumatoid arthritis). All participants provided informed consent and the study was approved by Nottingham Research Ethics Committee 1 (reference 10/H0403/70).
Materials and procedure
An invitation letter to join the study was sent to potential participants. Those interested in taking part were asked to complete a set of questionnaires comprising measures of pain, anxiety, depression, acceptance, self-efficacy, coping, beliefs, helplessness, fatigue and quality of life. As this was a large set of questionnaires, participants were permitted to stop at the half-way point. Furthermore, the order of presentation was randomized into 1 of 4 orders. Participants were provided with a pre-paid envelope so that they could return their completed questionnaires by post. One reminder letter was sent after 3 weeks if the individual had not since undergone knee replacement surgery. Data from the CPAQ-R questionnaire and the Intermittent and Constant Osteoarthritis Pain (ICOAP) scale (29), which provides an indication of OA pain severity, are reported in the current article. A Rasch analysis of the ICOAP has been previously published with this sample (30).
The CPAQ-R uses a 7-point response scale (0 = never true, 1 = very rarely true, 2 = seldom true, 3 = sometimes true, 4 = often true, 5 = almost always true, 6 = always true). Eleven items assess AE and the remaining 9 items measure PW. A total score can be calculated by summing all items on the scale once the PW items have been reverse scored.
Rasch analysis
The process of Rasch analysis has been extensively reviewed in the literature (e.g. 24, 26, 31) and so only a brief summary is provided. The AE subscale, PW subscale and Total scale were analysed separately using Rasch Unidimensional Measurement Models (RUMM2020) (32).
Although likelihood ratio tests for the CPAQ-R subscales suggested that the Rating Scale Model (33) could be used, it was decided that partial credit parameterization (34) would be more suitable. This was because most items presented with disordered response thresholds. Re-scoring was undertaken for these items by collapsing appropriate adjacent categories.
Overall fit to the model was assessed using summary mean and standard deviation fit residuals for items and persons, and a χ2 test for the item-trait interaction. Good fit was indicated by means approximating 0 and standard deviations of approximately 1 (26, 35); the χ2 test should also not be significant at the 0.05 level following Bonferroni correction for the number of items (36). Fit statistics were also produced for the individual items and persons participating in the study. Fit residuals should be within the range–2.5 to +2.5. Individual χ2 and analysis of variance (ANOVA) tests were conducted for the items, and these should not be significant at the 0.05 level following Bonferroni correction (37). Misfitting items and persons were considered for deletion if it improved overall fit to the model. Items were also inspected for evidence of differential item functioning (DIF) for gender (men and women) and age (< 64, 64–71 and > 71 years) using ANOVA tests with Bonferroni corrections. The specified age strata were chosen to reflect relatively balanced numbers across the strata, and were based on strata used in related work (28). Local response dependency was explored by examining the residual correlation matrix. Correlations of 0.3 and above were deemed to be exhibiting response dependency (36), which was dealt with using the subtest procedure in RUMM2020.
Finally, each scale was tested for a breach of unidimensionality. Divergent subsets of items within a scale, identified using a PCA of the residuals, were used to generate separate person estimates that were then compared using t-tests (38). A unidimensional scale should have no more than 5% of these tests significant, and a binomial confidence interval was used when slightly more than 5% were significant (39). The person separation index (PSI) was calculated to provide an indication of reliability. A minimum value of 0.7 was required for a scale (24). In addition, person-item threshold distribution graphs were plotted to examine targeting.
The sample size of the current study was sufficient to have 99% confidence that the item calibrations were within ± 0.5 logits (40), which is acceptable for initial exploratory work of this kind.
RESULTS
A total of 474 people were invited to take part. Restricted demographic information was available from this total group of invitees (age n = 458, gender n = 349). Their mean age was 67 years (standard deviation (SD) 10), and there were 180 women (52%). Data were provided by 176 participants (37% of those invited) for analysis. The mean age of participants was 66 years (SD 10) and there were 89 women (51%). All participants had a Kellgren-Lawrence grade of at least 2 for 1 knee. The median (interquartile range; IQR) scores for the AE, PW and Total CPAQ scales were 44 (36–51), 27 (20–34) and 71 (61–79). In total, there were 33 participants (18.8%) with missing data on 1 or both of the CPAQ scales. The scores for the ICOAP Constant and Intermittent scales were 45 (30–60) and 50 (38–67), with missing data for 7 (4.0%) participants on 1 or both scales. Participants with missing data were not included in these calculations, but their data were used in the Rasch analyses.
Available age and gender information was compared for subjects who were included in the analysis and those who were not. A χ2 test confirmed that there was no significant difference between the ratio of men and women in the 2 groups (52% women invited, 51% women participated), χ2 = 0.14, df = 1, p = 0.70. An independent samples t-test showed that the participants who were included in the analysis were significantly younger than those who were not (mean age invited = 67 years, mean age included = 66 years), t = 2.06, df = 456, p = 0.04.
Activity engagement
All items, except for 1 (I am getting on with the business of living no matter what…), 2 (My life is going well, even though I have chronic pain…) and 6 (Although things have changed, I am living a normal life…), presented with disordered response thresholds. The initial fit statistics indicated a deviation between the observed data and the predictions of the Rasch model (Table I). For example, item 3 (It’s OK to experience pain… Fit Residual = 2.61, χ2 = 5.35, p = 0.07; F = 2.07, p =0.13) misfit, as did items 5, 6, 8, 9, and 10, and 9% of the participants (fit residuals <> ± 2.5), misfit the model. Items 1 and 2 exhibited response dependency (0.35), but there was no evidence of DIF for gender or age (all p > 0.05). In the PCA of the residuals, items 1, 2, 6, 9, 12 and 15 negatively loaded, and items 3, 5, 8, 10 and 19 positively loaded. Nineteen out of 176 t-tests were significant, representing 10.8% of the tests (binomial CI: 7.6–14.0%).
|
Table I. Summary fit statistics for the Activity Engagement subscale, Pain Willingness Subscale and Total scale |
|||||||
|
Analysis |
Items n |
Item-fit residual Mean (SD) |
Person-fit residual Mean (SD) |
χ2 (DF) |
p-value |
Person Separation Index (PSI) |
Significant t-tests % (95% CI) |
|
Activity Engagement Initial |
11 |
1.24 (2.09) |
–0.32 (1.55) |
93.65 (22) |
< 0.0001 |
0.82 |
10.8 (7.6–14.0) |
|
Re-score |
11 |
0.05 (1.36) |
–0.27 (0.86) |
35.57 (22) |
0.03 |
0.74 |
4.2 |
|
Pain Willingness Initial |
9 |
0.61 (1.60) |
–0.46 (1.60) |
49.54 (18) |
0.0001 |
0.87 |
8.2 (5.0–11.5) |
|
Re-score |
9 |
–0.01 (1.37) |
–0.24 (1.12) |
34.95 (18) |
0.01 |
0.81 |
2.4 |
|
Removal of 5 participants and Item 14 |
8 |
0.06 (1.04) |
–0.19 (0.97) |
25.34 (16) |
0.06 |
0.78 |
1.9 |
|
Total Scale Initial |
20 |
0.96 (1.87) |
–0.37 (2.00) |
119.44 (40) |
< 0.0001 |
0.84 |
25.3 (22.0–28.5) |
|
Re-score |
20 |
0.34 (1.61) |
–0.18 (1.07) |
88.91 (40) |
< 0.0001 |
0.78 |
23.6 (20.3–26.8) |
|
Removal of 4 participants |
20 |
0.30 (1.54) |
–0.16 (1.01) |
86.26 (40) |
< 0.0001 |
0.78 |
22.4 (19.1–25.6) |
|
Removal of Items 14 and 20 |
18 |
0.30 (1.30) |
–0.16 (0.93) |
50.72 (36) |
0.05 |
0.73 |
18.8 (15.5–22.1) |
|
Subtests for Items 2 and 6; 11 and 16 |
16 |
0.35 (1.22) |
–0.16 (0.92) |
48.34 (32) |
0.03 |
0.71 |
14.1 (10.8–17.4) |
|
Removal of 3 participants and items 9 and 18 |
14 |
0.36 (0.77) |
–0.17 (0.87) |
31.40 (28) |
0.30 |
0.64 |
10.8 (7.5–14.1) |
|
Ideal value |
0.00 (1.00) |
0.00 (1.00) |
> 0.05 |
> 0.70 |
< 5% |
||
|
SD: standard deviation; 95% CI: 95% confidence interval; DF: degrees of freedom. |
|||||||
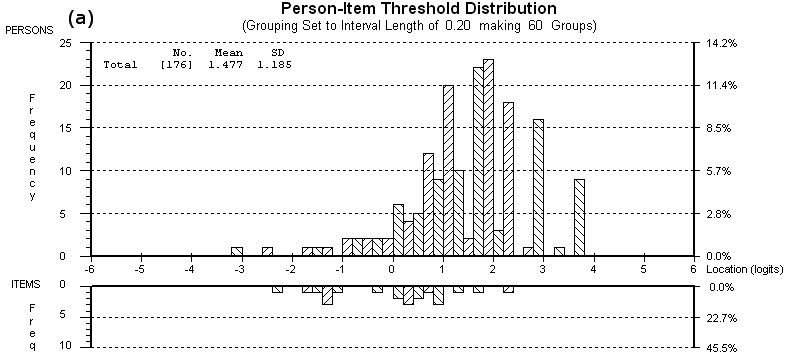
A global re-score was undertaken by collapsing response options 0 and 1 (never – very rarely true), 2 and 3 (seldom – sometimes true), and 4, 5 and 6 (often – always true). This scoring system was chosen for several reasons. First, it improved the summary fit statistics (Table I). Secondly, it resolved the widespread, and similarly natured, disordering that was observed within the scale. Thirdly, it is a simple system and it would be easy for researchers and clinicians to apply increasing its potential utility. Alternative scoring options were explored, but they resulted in worse fit. The p-value associated with the item-trait interaction statistic was slightly less than 0.05, but was within an acceptable range (37). The subscale had no misfitting items or persons, no response dependency or DIF and passed the test of unidimensionality (4.2%). Fig. 1 shows the person-item threshold distribution and reveals that the participants were, on average, at a higher level of AE than the items on the revised scale. Ceiling and floor effects were moderate (6%). Two one-way between groups ANOVAs were performed to determine if the person-item threshold distribution differed according to person factors, and no differences were found for gender (F(1, 174) = 0.07, p =0.79) or age (F(2, 173) = 0.41, p =0.66).
Pain willingness
With the exception of item 7, all items had disordered response thresholds and there was evidence of misfit between data and the model (Table I). Items 14 and 16 misfit the model, and 13% of the participants had fit residuals outside of the acceptable range. There was no response dependency between the items or DIF (all p > 0.05). Items 4, 7, 11, 16 and 18 positively loaded and items 13, 14, 17 and 20 negatively loaded in the PCA. In total, 8.24% (binomial CI: 5.0–11.5%) of the t-tests were significant, consistent with a unidimensional measure.
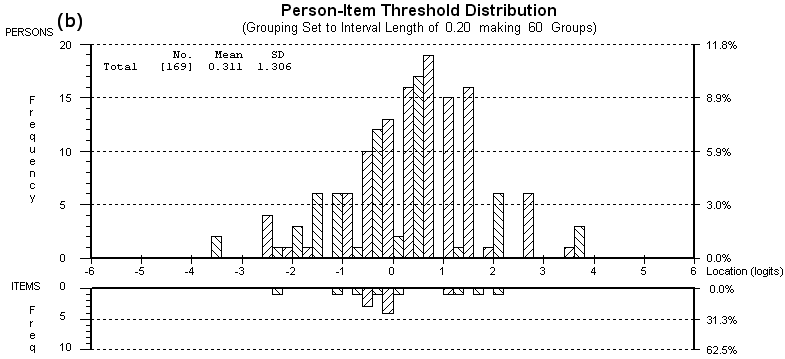
All items were re-scored 0011222, which improved the fit statistics. However, item 14 and 5 participants (3%) continued to exhibit misfit. Their removal from the analysis resulted in adequate fit to the model (as shown in Table I). There was no evidence of response dependency or DIF for age and gender and the subscale was unidimensional (1.9% of t-tests significant). The person-item threshold distribution shows that the revised PW subscale was better targeted than the AE subscale (Fig. 2). The mean person location was 0.31, which was higher than the fixed mean item location of 0. Therefore the persons were, on average, at a slightly higher level of pain willingness than the items in the subscale. Floor and ceiling effects were low (5%). Two 1-way between-groups ANOVAs were performed to determine if the person-item threshold distribution differed according to person factors. No significant differences were found for gender (F(1, 167) = 0.34, p =0.34); however, there was a significant, yet relatively small, effect for age (F(2, 166) = 3.62, p =0.03, η2 = 0.04). Post-hoc comparisons using Gabriel’s test indicated that the mean person-item threshold for participants in the 64–71 year age group (mean 0.63, SD 1.32) was higher than that of participants over the age of 71 years (mean –0.04, SD 1.24).
Total scale
Disordered response thresholds were observed for all items except for item 2. The summary fit statistics displayed in Table I indicated substantial misfit between the data and the model. Items 8, 10 and 16 misfit the model and 21% of participants had high fit residuals. Response dependency was observed between items 1–2 (0.39), 1–9 (0.35), 2–6 (0.36), 6–9 (0.37), 6–19 (0.31), 11–14 (0.33), 11–18 (0.30) and 13–14 (0.43). There was, however, no DIF for gender or age (all p > 0.05). PCA of the residuals identified items that loaded positively (1, 2, 3, 5, 6, 8, 9, 10, 12, 15 and 19) and negatively (4, 7, 11, 13, 14, 16, 17, 18 and 20) on the first extracted component. Forty-four out of 174 t-tests were significant representing 25.3% (binomial CI: 22.0–28.5%) of the tests.
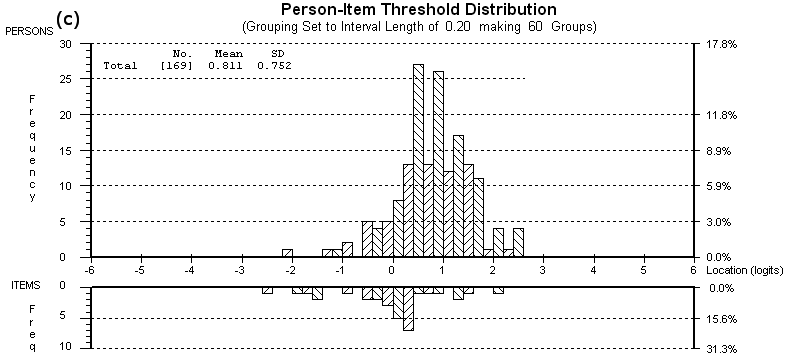
The items were re-scored 0011222, and 4 participants (2%), along with items 14 and 20, were removed due to persistent misfit, which improved overall fit statistics (Table I). Following these changes, item 4 exhibited some evidence of misfit, but removal of it did not enhance the summary fit statistics, and so it was retained. Items 2 and 6, and items 11 and 16 were grouped into subtests due to response dependence to form 2 super-ordinate items (items 2 + 6: Living normally despite chronic pain… and Items 11 + 16: Changing negative thoughts about pain…). This produced acceptable fit statistics (Table I), but there was still evidence of multidimensionality (14.1%; binomial CI: 10.8–17.4%). Re-examination of the results showed that 1 participant and item 18 misfit after the subtest procedure. It was decided to remove them to determine whether they were affecting the dimensionality tests. In addition, a further 2 participants and item 9 were also removed due to subsequent misfit. Although this produced adequate fit statistics with no evidence of response dependency or DIF, the PSI of the revised scale was very low (0.64) and it continued to exhibit multidimensionality (10.8%; binomial CI: 7.5–14.1%). The remaining PW items (4, 7, 11+16, 13, 17) positively loaded on the first component and the AE items (1, 2+6, 3, 5, 8, 10, 12, 15, 19) negatively loaded. The person-item threshold distribution shown in Fig. 3 indicated that the participants were, on average, at a higher level of overall pain acceptance than the items on the Total scale. No ceiling or floor effects were observed.
DISCUSSION
Rasch analysis of CPAQ-R in people with knee OA supports conclusions using other statistical methods in other populations (9, 13, 14, 19) that activity engagement and pain willingness represent distinct aspects of pain acceptance. CPAQ-R subscales, with minor modifications (item re-scoring 0011222 and removal of item 14) are suitable for outcome measurement in interventional studies, although the Activity Engagement subscale exhibited some evidence of mis-targeting, since participants with knee OA tended to report high levels of activity engagement. In contrast to its subscales, the CPAQ-R total score, even after revision, exhibited multidimensionality, with items in the 2 subscales loading in opposite directions. It has been suggested that unaddressed response dependency can potentially be interpreted as multidimensionality (41), with some research groups use a more stringent cut-off of 0.2 to identify response dependency (42). The current study used the commonly used criterion of 0.3; however, there were 9 correlations of between 0.2 and 0.3, which may have affected the estimation of test information, such as the person separation index in the current analysis (43).
Acceptance is increasingly becoming a target for interventional studies (3). When examining the effectiveness of interventions it is important to establish whether they result in positive changes in patients’ outcomes. Questionnaires provide ordinal data, which do not support the calculation of change over time, because differences in the sizes of the intervals between consecutive values mean that similar numerical changes may have very different biological or clinical meaning according to whether they occur at the top or bottom of the scale (24). Fit to the Rasch model permits transformation of raw questionnaire data to interval scores, allowing for the proper calculation of change. Our data indicate that raw CPAQ-R scores may suffer from this limitation, and that the use of Rasch-transformed data from CPAQ-R subscales may more appropriately be used, for example, to establish whether an intervention has had a beneficial effect.
McCracken et al. (9) proposed that the CPAQ-R was composed of 2 dimensions termed Activity Engagement and Pain Willingness, which has been supported by subsequent studies (12, 13). However, Nicholas & Asghari (11) found evidence that the Pain Willingness component may be broken down into 3 factors. The current study has shown that the Total scale exhibits multidimensionality, which supports previous work and lends further credence to the proposal that acceptance of pain is not a singular construct. Furthermore, the Activity Engagement and Pain Willingness subscales were found to be unidimensional following re-scoring, endorsing the structure proposed by McCracken et al. (9) and in contrast to the alternatively proposed 3-factor model.
There was a tendency for response options at the extreme ends (i.e. response options 0: never true; and 6: almost true) of the rating scales to show a high probability of being selected. This contrasts with response options 1 (very rarely true), 2 (seldom true) and 5 (almost always true), which often exhibited a relatively low probability of selection leading to disordered thresholds. Ideally response options should be selected in a manner consistent with the level of trait being measured (24). Disordered thresholds refer to occasions when this does not occur. This substantially affected fit to the model and so re-scoring was undertaken. Due to the similar nature of the disordered thresholds, and for simplicity of use by researchers and clinicians, a global re-score was undertaken, which resolved the problem and improved fit. Disordered thresholds can be due to having too many response options, which participants find difficult to differentiate (26). The CPAQ-R has a relatively large number of options (7) and some of them appear quite similar (e.g. very rarely true – seldom true). Although additional response options add opportunity for greater variations in responses, it seems that the use of all 7 choices is adversely affecting the questionnaires’ measurement properties. It is therefore recommended that the number of response options is reduced or that re-scoring is undertaken by those wishing to produce scores from this questionnaire.
The revised Activity Engagement subscale and Total scale were slightly mis-targeted; participants tended to be at a higher level of trait than represented by the items. Future research may therefore consider introducing additional items that assess higher levels of acceptance. However, the mis-targeting may be a population-specific effect and other patients groups with lower overall acceptance levels may not require additional items. Targeting affects the reliability of the fit statistics. However, even with average to poor targeting, the study had sufficient participants to be 95% confident that the item calibrations were within 0.5 logits (40). Future work with larger sample sizes is recommended.
The CPAQ-R has been previously applied to people with different painful conditions including low-back pain, headache pain, haemophilia pain and arthritis pain (e.g. 2, 14, 20–22, 44). Our study sample comprised people who reported knee pain associated with a diagnosis of knee OA. CPAQ-R responses suggested generally higher pain acceptance in our sample compared with that reported in other populations with chronic pain, although further research is required to determine whether fit to the Rasch model is independent of diagnostic classification. Understanding of the meaning and consequences of pain may differ between diagnostic groups, which may affect acceptance (45). Furthermore, many of our participants were recruited through participation in previous community surveys and had been dealing with their pain for several years. This may, in part, explain the relatively high levels of acceptance of pain. Nevertheless, a proportion of people with knee OA displayed low acceptance, suggesting that there may be subgroups that could benefit from interventions.
The response rate (37% of those invited provided data that was used in the Rasch analyses) was similar to that in other studies (35), but may limit the generalizability of our results, and replication with larger sample sizes would be useful. However, responder and non-responder groups had comparable numbers of women and men. Although there was a significant difference in the ages of responders and non-responders, the difference was small and unlikely to have affected the results. Furthermore, our study participants were both from community and secondary care populations, and reported a wide range of pain severity.
In conclusion, the results support the conception of the CPAQ-R as measuring 2 distinct components of acceptance: Activity Engagement and Pain Willingness. The subscales can be adjusted to meet the requirements of the Rasch model and therefore have good measurement properties. Conversion values are available in the Appendix to allow an interval level transformation of the ordinal questionnaire data following appropriate re-scoring and removal of item 14. These values can be used in clinical practice to facilitate the use of parametric statistics and analysis of change over time. However, it is recommended that further work is conducted with larger sample sizes and different patient groups, and using the reduced number of response options. In particular, an examination of targeting across different chronically painful conditions would be useful. Further research should explore the potential of interventions to improve quality of life for people with knee OA by increasing acceptance of chronic pain.
ACKNOWLEDGEMENTS
The authors would like to thank Professors Doherty and Scammell for their assistance with the project. The authors would also like to thank Deborah Wilson and Linda Miller for their support with participant recruitment. Finally, the authors are grateful to all the study participants for taking the time to participate.
The authors declare no conflicts of interest.
APPENDIX
Appendix I. Rasch conversion table for the Activities Engagement and Pain Willingness subscales. To convert raw Chronic Pain Acceptance Questionnaire Revised (CPAQ-R) scores to interval level data, re-score the individual items as follows: never true (0), very rarely true (0), seldom true (1), sometimes true (1), often true (2), almost always true (2), always true (2). In addition, for the Pain Willingness subscale, discount responses to item 14. Summative total scores can then be transformed to Rasch scores using the tables provided below | |||
Activity Engagement Raw score | Activity Engagement Rasch score | Pain Raw score | Pain Rasch score |
0 | 0 | 0 | 0 |
1 | 2.39 | 1 | 2.04 |
2 | 4.09 | 2 | 3.46 |
3 | 5.33 | 3 | 4.44 |
4 | 6.34 | 4 | 5.23 |
5 | 7.20 | 5 | 5.91 |
6 | 8.01 | 6 | 6.54 |
7 | 8.73 | 7 | 7.13 |
8 | 9.39 | 8 | 7.69 |
9 | 10.05 | 9 | 8.31 |
10 | 10.68 | 10 | 8.92 |
11 | 11.29 | 11 | 9.62 |
12 | 11.86 | 12 | 10.39 |
13 | 12.47 | 13 | 11.29 |
14 | 13.07 | 14 | 12.40 |
15 | 13.71 | 15 | 13.92 |
16 | 14.34 | 16 | 16 |
17 | 15.06 | ||
18 | 15.84 | ||
19 | 16.79 | ||
20 | 17.94 | ||
21 | 19.61 | ||
22 | 22 | ||
REFERENCES

