Louise Pape Larsen, MPH1,2, Karin Biering, MPH, PhD3, Soeren Paaske Johnsen, MD, PhD4, Grethe Andersen, MD, DMSc5 and Niels Henrik Hjollund, MD, PhD1,4
From the 1AmbuFlex/WestChronic, Regional Hospital West Jutland, Herning, 2Department of Clinical Medicine, Faculty of Health Sciences, Aarhus University, Aarhus, 3Department of Occupational Medicine, Regional Hospital West Jutland, Herning, 4Department of Clinical Epidemiology and 5Department of Neurology, Aarhus University Hospital, Aarhus, Denmark
OBJECTIVE: Self-rated health is an essential aspect of life after stroke, and return to work is considered one of the most important outcomes for younger stroke patients. The aim of this study was to examine whether self-rated health 3 months after stroke, clinical and demographic determinants are independently associated with return to work and subsequent work-stability.
Material and methods: A total of 590 patients with first-time stroke were included from a Danish population-based cohort study. All patients were younger than 60 years and working or unemployed at the time of stroke. Information on self-rated health (Short Form 12; SF-12) was collected from questionnaires 3 months after stroke. Employment status was defined on a weekly basis using national register-data on transfer payments.
RESULTS: Fifty percent were self-supporting or job-seeking 12 months after stroke, and the same proportion was found after 24 months. More than 70% of the patients who returned to work did not receive sickness benefits in the 12 months following return to work. Good self-rated health 3 months after stroke and minor stroke severity were strongly associated with return to work after 12 and 24 months.
CONCLUSION: Self-rated health 3 months after stroke was strongly associated with return to work and work-stability after stroke.
Key words: cohort studies; quality of life; return to work; stroke.
J Rehabil Med 2016; 48: 00–00
Correspondence address: Louise Pape Larsen, AmbuFlex, Regional Hospital Jutland, Gl. Landevej 61, DK-7400 Herning, Denmark. E-mail: anllar@rm.dk
Accepted Dec 11, 2015; Epub ahead of print Mar 2, 2016
INTRODUCTION
In the Scandinavian countries, the incidence of stroke is approximately 2 per 1,000 person-years (1). The majority of stroke patients are over 65 years of age at the time of stroke and have already left, or are about to leave, the labour market. However, approximately 20–30% of stroke patients are younger than 65 years, and a substantial part are eligible for return to work (RTW) (2). Among stroke patients of working age, RTW has been identified as one of the most important outcomes in terms of social functioning, wellbeing and life satisfaction for the patients (3, 4). In addition, being employed facilitates independent living for the patients and decreases the financial burden on society (5, 6).
Many factors have been investigated as possible risk factors for post-stroke patients’ ability to RTW, and several risk-factors for RTW after stroke have been identified in demographic, physical, clinical and social fields (7, 8).
Self-rated health or health-related quality of life has been defined by the World Health Organization (WHO) as “an individual’s perception of their position in life in the context of the culture and value systems in which they live, and in relation to their goals, expectations, standards and concerns. A self-reported measure consisting of multiple dimensions that includes, but is not limited to the concepts of physical, social and emotional health” (9). This definition emphasizes subjective health and embodies the perception and evaluation by patients themselves of the impact on their lives caused by the disease and its consequences (10). Self-rated health has been reported to be an important predictor of the prognosis of stroke patients (11), but whether or not self-rated health is also associated with RTW is unknown.
Another issue sparsely investigated is the stability of employment after returning to work. A German study found that 28% of the patients who returned to work in a mixed population (head injury and stroke), left the workforce permanently within a 2-year period (12). This suggests that remaining at work may be a challenge for these patients.
Great variation has been found in previous studies describing the proportion of patients returning to work after stroke (8). This may be due to different populations and measurements, but also limited sample sizes in the majority of studies may be part of the explanation.
The aim of this study was to describe RTW and the subsequent work-stability in a Danish population-based cohort of stroke patients, and to examine whether self-rated health 3 months after stroke, clinical and demographic determinants are independently associated with RTW and work-stability.
MATERIAL AND METHODS
Subjects and study design
The study population consisted of patients with first-time stroke, who had been admitted to a hospital in the Central Denmark Region between 1 October 2008 and 31 December 2011. Central Denmark Region is one of 5 administrative units in Denmark, with approximately 1.2 million inhabitants (13). During the study period the region was served by 7 stroke units. All patients were identified from the Danish Stroke Register (DSR), which is a nationwide initiative to monitor and improve the quality of care for patients with acute stroke (14).
The study was nested in a larger cohort study investigating self-reported health among first-time stroke patients. In the main study, patients younger than 80 years, who were alive 90 days after stroke and living in their own homes prior to the stroke were included and invited to participate in a follow-up study. Three months after the stroke, a short questionnaire including questions on self-rated health (SF-12) was delivered by post. If the patients responded, they would receive a more comprehensive questionnaire 3 months later and subsequently every 6 months until 2.5 years from stroke onset. The follow-up questionnaires included items on self-rated health (SF-12) (15), degree of disability (WHO, Disability Assessment Schedule; WHODAS) (16), anxiety and depression (Hospital Anxiety and Depression Scale; HADS) (17), and educational level. Non-respondents were sent a new questionnaire 3 months later and again 6 months after the first questionnaire if there was still no response. Since 1968, all Danish residents have been assigned a unique civil registration number, which is used in all health databases and permits unambiguous record linkage between databases. The Civil Registration System contains information on civil registry number, name, gender, address, date of birth and vital status (18). Information on address and vital status was collected online prior to approaching the individual patient.
In Denmark, people in the age range 60–66 years have the opportunity to take early retirement. All included patients were 60 years or younger at time of stroke, and were either working or unemployed prior to the stroke, making RTW an option.
Working status
Information on weekly employment status was collected from The Danish Register for Evaluation of Marginalisation (DREAM), which includes information on all public transfer payments administered by Danish ministries and municipalities since 1991. In Denmark, employed citizens are entitled to sick-leave benefit after 2 weeks of employment, or, if an employer pays their salary during sick leave, the employer receives municipal reimbursement. If there is no transfer income registered for a specific week, the person is considered to be self-supporting or on short-term sick leave. It was not possible to detect whether the patient returned to the same job and the same amount of working hours per week. Patients were registered as being on sick leave if they received health-related benefits, even though they had begun working part-time. Data from the DREAM database have been compared with other sources of information and found valid (19, 20).
Four outcome variables were defined:
1. Employment status. Employment status was categorized into 5 groups (20): 1. Self-supporting (no transfer income apart from maternity leave pay and state education fund grants.). 2. Job-seeking (patients receiving labour market-related benefits.). 3. Sick-leave (patients receiving sickness benefits, vocational rehabilitation or in a flex job (jobs created for persons with limited work capacity)). 4. Permanently out of the labour market (patients on normal or early retirement. Early retirement (persons over 60 years who have retired voluntarily or who are on an anticipatory pension scheme). 5. Dead
Employment status was measured at 3 specific time-points: 3, 12 and 24 months after stroke.
2. Return to work. RTW was defined as being self-supporting or job-seeking for at least 4 consecutive weeks from time of stroke and up to 24 months thereafter, and was dichotomized into yes/no. Job-seeking patients receiving labour market-related benefits were categorized as having returned to work, since such benefits are only granted if a person is assessed to be ready to work.
3. Work-stability. A “Work Participation Score” within 12 months following RTW was calculated as the proportion of the number of weeks at work or as a job-seeker in the numerator and the number of weeks receiving sickness benefits or pension plus the number of RTW weeks in the denominator (19). The “Work Participation Score” was categorized into 3 groups reflecting the percentages of weeks at work for descriptive use and dichotomized at 80% in regression analysis.
4. Transitions. Transitions were defined as the number of transitions between self-supporting or job-seeking and being on sick leave or retirement during the following 12 months after RTW. Transitions were categorized into 3 groups with 0, 1–2 and 3 or more transitions.
Self-rated health
The Short Form 12 (SF-12) is a generic measure of self-rated health that describes the patients’ experiences of function and well-being in physical, mental and social dimensions of life during the previous 4 weeks (15). The SF-12 consists of 12 questions that correspond to 8 subscales and 2 summary scores (Physical Component Summary (PCS) and Mental Component Summary (MCS)). All of the SF-12 scores are graded from 0 to 100, with higher scores indicating better health. The summary scores are norm-based with a mean of 50, and the SD equals 10 in a US population sample (15). The 8 subscales were categorized into 4 groups with cut-offs at 25, 50 and 75 points on the scale. The summary scores were categorized with cut-offs at the 25th, 50th and 75th percentiles. The Danish translation of the standard SF-12 version 2.0 was used, with scoring as suggested by Ware et al. (15, 21). The SF-12 has shown satisfactory reliability and validity in previous studies of stroke patients (22–24).
Covariates
Gender and age were identified from the civil registration number. Information about marital status, body mass index (BMI), alcohol consumption, smoking, type of stroke and stroke severity was obtained from the DSR. Stroke severity at time of admittance was evaluated by the Scandinavian Stroke Scale (SSS), which is graded from 0–58, with low scores indicating high severity (25, 26). Educational level was obtained from the questionnaire (after 6 months) and categorized according to the International Standard Classification of Education (27). If information on educational level was missing in the questionnaire, register-based information on trade union membership was used to estimate this (20). Information on co-morbidity was obtained from the Danish National Patient Registry and re-coded into the Charlson Comorbidity Index (28). Apart from stroke, which was not included in the calculation of the index, very few patients had more than 1 co-morbid disease, and for that reason the index was dichotomized at 0/1 in the analysis.
Statistical analysis
A correlation analysis between exposure variables was initially performed, and no correlation exceeded 0.10. Adjusted odds ratios (OR) of the association between SF-12, covariates and RTW after 12 and 24 months of follow-up were calculated using multivariable logistic regression. Analysis of RTW and SF-12 components were adjusted for age, gender, educational level, co-morbidity and stroke severity. Age, gender, educational level, comorbidity and stroke severity were mutually adjusted and adjusted for PCS. Survival analysis was originally considered the most appropriate analysis for the aim of this study. However, only patients available for RTW (on sick leave) 3 months after the stroke could be included in this time-to-event analysis. Hence, the analysis was produced to substantiate results of the logistic regression. Cox regression was used to estimate the hazard ratio (HR) or risk rate ratio for RTW 12 months after stroke according to exposure variables, taking competing risks (retirement and death) into account. The HR can be interpreted as a relative risk. The association between self-rated health and the Work Participation Score was also computed by multivariable logistic regression. Multiple imputations were used to handle missing data. The imputation model was based on register-based data as well as data from the questionnaires and took the individual time course into account. A total of 25 datasets were imputed. All analysis were performed both with and without the imputed data, and the results compared. Furthermore, a sensitivity analysis, assuming that all missing data were from patients with 5 points (0.5 SD) lower or higher self-rated health than estimated with the imputation model, was carried out. All data management and statistical analysis were made using Stata 13.0 SE.
RESULTS
A total of 4,327 patients were identified in the DSR. Of these, 1,106 patients did not meet the inclusion criteria for the main study (Fig. 1). In all, 2,225 patients were older than 60 years at the time of stroke, and 214 received early retirement benefits before the stroke and were therefore not able to RTW. Eight patients died and thus did not return the questionnaire, and 184 did not respond, resulting in a study population of 590 patients (Fig. 1). During the first 3 months after stroke, 167 patients returned to work and 6 left the workforce due to early retirement. Thus, 417 patients were still available for RTW when the first measurement of self-rated health was made 3 months after the stroke.
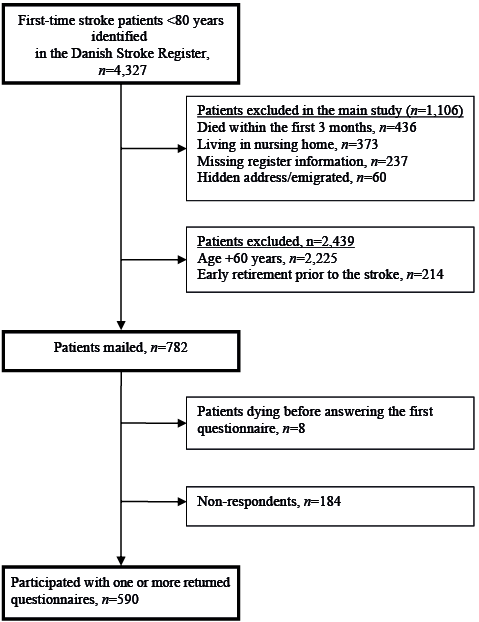
Fig. 1. Selection of study participants.
Baseline characteristics
Characteristics of the population are presented in Table I. Approximately two-thirds of the patients were men, and half of the population had attained a medium educational level. The proportion of patients having a mild stroke was 72%, and 86% of the patients had had an ischaemic stroke. More than three-quarters of the population did not have other diseases (Table I). Non-respondents were slightly younger, more often smokers and living alone (data not shown).
|
Table I. Patient characteristics at time of stroke and self-rated health after 3 months |
|
|
Characteristics |
All patients |
|
Total, n (%) |
590 (100) |
|
Gender, n (%) |
|
|
Female |
36 |
|
Male |
64 |
|
Age, n (%) |
|
|
≤ 49 years |
38 |
|
50–60 years |
62 |
|
Education, n (%) |
|
|
Low (< 11 years) |
21 |
|
Medium (11–14 years) |
51 |
|
High (> 14 years) |
25 |
|
Missing |
4 |
|
Marital status, n (%) |
|
|
Married/cohabiting |
78 |
|
Single |
21 |
|
Missing |
1 |
|
Stroke severity, n (%) |
|
|
Mild |
72 |
|
Moderate |
11 |
|
Severe |
5 |
|
Very severe |
5 |
|
Missing |
7 |
|
Diagnosis, n (%) |
|
|
Intracerebral haemorrhage |
11 |
|
Ischaemic |
86 |
|
Unspecified |
3 |
|
Comorbidity, n (%) |
|
|
Charlsons index 0 |
78 |
|
Charlsons index 1–2 |
19 |
|
Charlsons index 3+ |
3 |
|
Smoking status, n (%) |
|
|
Current |
44 |
|
Former |
19 |
|
Never |
32 |
|
Missing |
4 |
|
Alcohol, n (%) |
|
|
< 14/21 drinks per week |
84 |
|
> 14/21 drinks per week |
11 |
|
Missing |
5 |
|
Body mass index, n (%) |
|
|
< 25 kg/m2 |
28 |
|
25–30 kg/m2 |
34 |
|
> 30 kg/m2 |
22 |
|
Missing |
15 |
|
SF-12, mean (SD) |
|
|
Physical Component Score (PCS) |
44.0 (10.9) |
|
Mental Component Summary (MCS) |
44.2 (11.1) |
|
Physical Functioning (PF) |
66.4 (32.7) |
|
Role Physical (RP) |
53.1 (30.4) |
|
Bodily Pain (BP) |
73.3 (30.1) |
|
General Health (GH) |
55.4 (26.4) |
|
Vitality (VT) |
40.4 (27.3) |
|
Social Functioning (SF) |
74.2 (27.9) |
|
Role Emotional (RE) |
61.9 (30.6) |
|
Mental Health (MH) |
63.5 (21.9) |
|
SF-12: Short Form 12; SD: standard deviation. |
|
Employment status
One year after the stroke, 294 patients (50%) were self-supporting or job-seeking, 66 (11%) had left the workforce permanently, and 230 (39%) were still on sick leave (Table II). Two years after the stroke, 48% were self-supporting or job-seeking, while 36% had left the workforce permanently and 16% were on sick leave (Table II). For patients still on sick leave 3 months after the stroke, the proportion of patients in work or job-seeking was approximately 30% after 12 and 24 months, respectively. Among the patients who returned to work during the first 3 months (n = 167), the proportion of self-supporting or job-seeking patients after 12 months was 91% (Table II).
|
Table II. Employment status 12 and 24 months after stroke according to study population |
||||||||||
|
|
N |
12 months |
|
24 months |
||||||
|
Self-supportinga n (%) |
Job-seekingb n (%) |
Sick-leavec n (%) |
Permanently outd n (%) |
|
Self-supportinga n (%) |
Job-seekingb n (%) |
Sick-leavec n (%) |
Permanently outd n (%) |
||
|
All patientsc |
590 |
278 (47) |
16 (3) |
230 (39) |
66 (11) |
|
285 (48) |
1 (0) |
92 (16) |
212 (36) |
|
On sick leave at 3 months |
417 |
130 (31) |
12 (3) |
222 (51) |
53 (13) |
|
141 (34) |
1 (0) |
83 (20) |
192 (46) |
|
RTW during the first 3 months |
167 |
148 (89) |
4 (2) |
8 (5) |
7 (4) |
|
144 (87) |
0 (0) |
9 (5) |
14 (8) |
|
aSelf-supporting: Patients who are employed, receiving education fund grants, maternity leave pay and leave-of-absence schemes. bJob-seeking: Patients receiving unemployment benefits. cSick-leave: Patients receiving sickness benefits, vocational rehabilitation and flex job. dPermanently out of labour market: Patients receiving normal, and early, retirement, including patients who died during the follow-up (At 12 months n = 3; 24 months n = 10). eAll patients eligible at time of stroke including 6 patients who retired during the first 3 months. RTW: return to work. |
||||||||||
Self-rated health and return to work
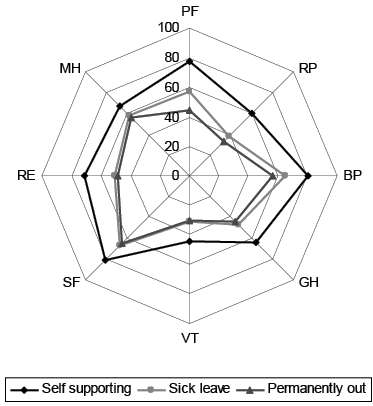
A high level of self-rated health 3 months after stroke was associated with higher odds of being at work 12 and 24 months after the stroke for all components of the SF-12 (Table III). In all scales, a better self-rated health was associated with a higher chance of RTW (Fig. 2). The largest difference between high and low self-rated health was found in the domains related to physical function, e.g. patients with high scores of physical function (PF) had a 9 times higher odds of RTW (adjusted OR 9.0 (95% confidence interval; 95% CI 4.4–18.5) compared with patients with low self-rated physical function. Also in General Health (GH) and in Role Emotional (RE), patients with high scores had more than 7 times higher odds of RTW within the first year. Although the risk estimates only differed marginally from the first to the second year, there was a steady trend towards a stronger association between self-rated health 3 months after stroke and being employed after 2 years compared with 1 year after the stroke (Table III).
|
Table III. Adjusted odds ratios (OR) of return to work 12 and 24 months after stroke according to Short Form 12 (SF-12), demographic and clinical determinants |
||||
|
SF-12 componentsa |
|
n |
Return to work |
|
|
12 months ORb (95% CI) |
24 months ORb (95% CI) |
|||
|
Total |
|
590 |
|
|
|
Mental Component Summary (MCS) |
0–34 |
120 |
Ref |
Ref |
|
35–42 |
140 |
1.5 (0.8–2.9) |
1.7 (0.8–3.4) |
|
|
43–50 |
152 |
1.9 (1.0–3.3) |
2.8 (1.5–5.0) |
|
|
51–100 |
178 |
4.0 (2.2–7.3) |
5.6 (2.9–10.5) |
|
|
Physical Component Summary (PCS) |
0–35 |
137 |
Ref |
Ref |
|
36–42 |
126 |
1.3 (0.7–2.5) |
1.5 (0.8–2.9) |
|
|
43–49 |
132 |
2.5 (0.4–4.6) |
2.8 (1.5–5.2) |
|
|
50–100 |
195 |
7.0 (3.9–12.6) |
7.1 (3.8–13.1) |
|
|
Physical Functioning (PF) |
0–25 |
105 |
Ref |
Ref |
|
26–50 |
171 |
1.9 (0.9–4.2) |
2.1 (1.0–4.4) |
|
|
51–75 |
84 |
3.7 (1.7–8.3) |
3.7 (1.6–8.7) |
|
|
76–100 |
230 |
9.0 (4.4–18.5) |
9.3 (4.4–19.6) |
|
|
Role Physical (RP) |
0–25 |
157 |
Ref |
Ref |
|
26–50 |
155 |
2.6 (1.4–5.0) |
3.4 (1.8–6.5) |
|
|
51–75 |
162 |
5.5 (3.0–9.9) |
5.3 (2.9–9.8) |
|
|
76–100 |
111 |
12.8 (6.2–26.5) |
14.5 (7.0–30.0) |
|
|
Bodily Pain (BP) |
0–25 |
97 |
Ref |
Ref |
|
26–50 |
74 |
1.1 (0.5–2.6) |
1.2(0.5–2.8) |
|
|
51–75 |
164 |
2.3 (1.1–4.4) |
2.0 (1.1–3.9) |
|
|
76–100 |
255 |
4.4 (2.3–8.2) |
4.0 (2.1–7.5) |
|
|
General Health (GH) |
0–25 |
181 |
Ref |
Ref |
|
26–50 |
250 |
2.6 (1.6–4.3) |
2.7 (1.6–4.6) |
|
|
51–75 |
129 |
6.3 (3.3–11.9) |
5.8 (3.1–10.9) |
|
|
76–100 |
30 |
15.2 (3.0–76.2) |
17.2 (3.5–85.2) |
|
|
Vitality (VT) |
0–25 |
280 |
Ref |
Ref |
|
26–50 |
168 |
2.6 (1.3–3.6) |
2.1 (1.3–3.4) |
|
|
51–75 |
125 |
5.2 (2.8–9.5) |
5.4 (3.0–9.5) |
|
|
76–100 |
17 |
6.5 (1.5–28.5) |
6.8 (1.6–28.5) |
|
|
Social Functioning (SF) |
0–25 |
75 |
Ref |
Ref |
|
26–50 |
101 |
1.6 (0.7–3.7) |
1.5 (0.6–3.7) |
|
|
51–75 |
165 |
2.2 (1.0–4.7) |
2.3 (1.0–5.1) |
|
|
76–100 |
249 |
4.4 (2.1–9.3) |
5.3 (2.5–11.4) |
|
|
Role Emotional (RE) |
0–25 |
110 |
Ref |
Ref |
|
26–50 |
149 |
2.1 (1.1–4.2) |
2.9 (1.4–6.2) |
|
|
51–75 |
143 |
3.5 (1.7–7.3) |
4.6 (2.0–10.4) |
|
|
76–100 |
188 |
7.7 (3.7–15.6) |
9.7 (4.5–20.8) |
|
|
Mental Health (MH) |
0–25 |
56 |
Ref |
Ref |
|
26–50 |
147 |
2.2 (0.9–5.0) |
1.7 (0.7–4.3) |
|
|
51–75 |
224 |
3.0 (1.4–6.6) |
3.0 (1.3–6.9) |
|
|
76–100 |
124 |
6.7 (2.6–14.3) |
7.2 (2.9–18.1) |
|
|
Gender |
Female |
210 |
Ref |
Ref |
|
Male |
380 |
1.3 (0.9–2.0) |
1.4 (0.9–2.1) |
|
|
Age |
–50 |
249 |
Ref |
Ref |
|
51+ |
341 |
1.7 (0.9–2.5) |
1.2 (0.8–1.8) |
|
|
|
|
|
|
|
|
Educational level |
Low |
129 |
Ref |
Ref |
|
Medium |
307 |
0.9 (0.6–1.5) |
1.1 (0.7–1.8) |
|
|
High |
154 |
1.1 (0.6–1.9) |
1.7 (1.0–3.0) |
|
|
|
|
|
|
|
|
Comorbidity |
0 |
458 |
1.0 (0.7–1.6) |
1.4 (0.9–2.3) |
|
1+ |
132 |
Ref |
Ref |
|
|
|
|
|
|
|
|
Stroke severity |
Moderate/mild |
524 |
5.0 (2.1–11.8) |
3.6 (1.7–7.9) |
|
Very severe/severe |
66 |
Ref |
Ref |
|
|
aSF-12 summary scores were categorized at the 25, 50 and 75th percentiles. The 8 subscales were categorized into 4 groups with cut-offs at 25, 50 and 75 points on the scale. bSF-12 components were adjusted for age, gender, educational level, co-morbidity and stroke severity. Age, gender, educational level, comorbidity and stroke severity were mutually adjusted and adjusted for Physical Component Summary. 95% CI: 95% confidence interval. |
||||
For patients still on sick leave 3 months after stroke (n = 417), time-to-event analysis with Cox regression found the same patterns in associations with better self-rated health associated with a higher chance of RTW. Adjusted HR for RTW was 3.7 (95% CI 2.1–6.5) for patients reporting very high vs. very low self-rated physical health (PCS). For MCS the corresponding HR was 2.4 (95% CI 1.4–4.1).
Other risk factors of return to work
Gender, age, educational level and co-morbidity were not significantly associated with the chance of returning to work 1 year after stroke. Conversely, patients who had experienced a mild or moderate stroke had a significantly increased chance of RTW after 1 year (OR 5.0; 95% CI 2.1–11.8) compared with patients with a more severe stroke. This effect decreased to an OR of 3.6 (95% CI 1.7–7.9) 2 years after the stroke (Table III).
Work participation score
A total of 370 patients experienced a 4-week period of RTW during the first 2 years after stroke (Table IV). Among patients returning to work during the first 3 months after stroke, 140 (78%) patients did not at any time receive sickness benefits the following 12 months after RTW, 26 (15%) worked between 50% and 99% of the weeks, and 13 (7%) worked less than half of the time. The proportion of patients not on sick leave the first year after initial RTW decreased to 64% among patients returning to work 3–12 months after the stroke, and to 56% for patients returning to work during the second year after stroke (Table IV). High levels of self-rated health were found to be associated with a higher Work Participation Score (Table V).
|
Table IV. Work stability 12 months after return to work (RTW) according to time of initial RTW |
||||
|
|
Time for RTW after stroke |
|||
|
0–3 months |
3–12 months |
12–24 months |
p |
|
|
n (%) |
n (%) |
n (%) |
||
|
Total (n = 370) |
179 (100) |
150 (100) |
41 (100) |
|
|
Work participation scorea |
||||
|
0–50% |
13 (7) |
15 (10) |
9 (22) |
0.003 |
|
50–99% |
26 (15) |
39 (26) |
9 (22) |
|
|
100% |
140 (78) |
96 (64) |
23 (56) |
|
|
Transitionsb (range 0–10) |
||||
|
0 |
146 (82) |
110 (73) |
29 (71) |
0.24 |
|
1–2 |
27 (15) |
31 (21) |
8 (20) |
|
|
3 + |
6 (3) |
9 (6) |
4 (9) |
|
|
aProportion of weeks at work the first 12 months after RTW. bTransitions between self-supporting or job-seeking and sick leave the succeeding 12 months after RTW. |
||||
|
Table V. Work stability after stroke according to Short Form 12 (SF-12) component scores for patients returning to work during the first year |
||
|
Total (n = 329) |
|
Work participation score |
|
Adjusted ORb (95% CI) |
||
|
Mental Component Summarya |
0–34 |
Ref |
|
35–42 |
2.6 (0.9–7.3) |
|
|
43–50 |
2.8 (1.1–7.2) |
|
|
51–100 |
2.8 (1.2–6.2) |
|
|
Physical Component Summarya |
0–35 |
Ref |
|
36–42 |
1.1 (0.4–2.8) |
|
|
43–49 |
1.7 (0.6–4.7) |
|
|
50–100 |
2.1 (0.9–4.9) |
|
|
aSF-12 summary scores were categorized at the 25, 50 and 75th percentiles. bMCS/PCS were adjusted for age, gender, educational level, co-morbidity and stroke severity. OR: odds ratio: 95% CI: 95% confidence interval. |
||
Transitions
The range of transitions between self-supporting and being on sick leave was 0–10 in the first year following RTW. Regardless of the time of RTW, in more than 70% of the patients there were no transition from self-supporting to sick leave in the 12 months following RTW (Table IV).
Missing data
Estimates were almost identical in the complete case analysis (data not shown) and the presented estimates based on imputed datasets. A sensitivity analysis, assuming that all missing data were from patients with 5 points lower or higher self-rated health than estimated with the imputation model, showed no difference in risk estimates for RTW according to demographic and stroke-related factors, compared with the observed and imputed dataset (data not shown).
DISCUSSION
In this population-based study of stroke patients, approximately 50% of the patients were self-supporting or job-seeking 12 months after the stroke, and the same proportion was found after 24 months. However, the proportion of patients leaving the labour market permanently increased during the second year, and conversely, the proportion of patients on sick leave decreased. High levels of self-rated health 3 months after stroke were strongly associated with RTW after 12 months. In this study, poor self-rated physical health 3 months after stroke was the strongest risk-factor for not returning to work after 12 months, but fatigue (vitality), poor general and mental health, stroke severity and role limitations due to mental problems also highly influenced the odds of RTW. More than 70% of the patients who returned to work did not receive any sickness benefits during the following 12 months, 20% worked between 50% and 99% of the weeks and only 8% worked less than half of the weeks. Good self-rated health was found to be associated with high work stability after returning to work.
In a review by Treger et al. (8) on RTW after stroke, a variation between 19% and 73% in RTW was found when comparing the results from 16 different countries. Our results were in accordance with previous findings from Denmark (29), but were lower than findings in other Scandinavian studies (6, 7). This could partly be explained by the way of measuring and defining RTW. We used register-based data in contrast to patient-reported data, and defined RTW as being self-supporting or job-seeking for at least 4 weeks in a row. It could also be due to structural causes, such as various offers of health-related benefits and rehabilitation services.
Self-rated physical health was strongly associated with RTW within the first year, with patients reporting a high level of physical health having 7 times higher odds of RTW than patients with low rates of physical health 3 months after stroke. Several studies have found impairment in activities of daily living to be an important determinant of returning to work among stroke patients (8, 30, 31), and Vestling et al. found that being able to walk was strongly associated with the chance of RTW after stroke (5). Depression and fatigue highly influence mental health and have also been found to be negatively associated with the chance of returning to work (8, 29, 32). This is in accordance with our findings, with patients reporting a high level of mental health having a 4 times higher odds of RTW after a year compared with patients with low ratings of mental health.
Stroke severity is, as in our study, previously found to be a consistent and influencing factor for RTW (33). Previous studies have, not surprisingly, found age over 65 years to be a negative predictor of RTW; however, there are various findings in the association between “younger” stroke patients and RTW (8, 33, 34). No association between age and RTW was found in this study. For that reason we only included patients younger than 60 years, and there were no obvious opportunity for retirement for the majority of patients. The association between gender and RTW varies in the literature, but the majority of studies found no association, as in our study (6, 7, 33). Trygged et al. found an association between educational level and RTW (6). A Danish study of the association between education and RTW after long-term periods of sick leave (of all causes) came to the same conclusion (35). Educational level was not associated with RTW in this study.
Twelve months is normally the maximum period of the sick-leave benefit in Denmark, and returning to work after this time could be prompted by economic reasons despite possible persisting problems, which may have reduced the effect of self-rated health on RTW in our study. In support of this assumption, we found that patients who returned to work more than 1 year after the stroke were more often absent owing to illness in the following 12 months.
Misclassification of RTW may occur for several reasons, for instance, patients could have been classified as being on sick leave if they received health-related benefits even though they had begun working part-time. Conversely, patients could have been classified as working if they did not receive any health-related benefits, irrespective of working hours per day. Patients who were not working, but who were provided with income by their spouses or lived outside established society, may have been categorized as self-supporting. Only 2% of the Danish population between 40 and 67 years are without personal income, making this latter speculation less of a problem (36).
The first 2 weeks of sick leave is paid by the employer and, for this reason, patients on short-term sick leave (less than 2 weeks) were classified as self-supporting in our analysis. This has contributed to an underestimation of the number of weeks of sick leave. Possible bias because of this may be differential in relation to self-rated health, since patients with low self-rated health are often more absent from work owing to illness.
In a broader perspective, RTW is contextual with economic trends, and this study was undertaken at the time of a global financial crisis, which presumably increased the difficulties of returning to the labour market for those with special needs or/and lower working capacity. The proportion of patients returning to work may therefore have been lower than it would have been if data had been collected during a period with a stronger economy. However, Andersen et al. found similar results in a study undertaken at a time with a historic low rate of unemployment in Denmark (29). This may indicate a relatively open and inclusive labour market in Denmark. This study may also indicate a need for exploring whether the rehabilitation services offered, i.e. to patients who report fatigue, are adequate in relation to RTW.
In conclusion, the majority of the patients who returned to work after stroke were not on sick leave the following year. However, it was only 50% of the patients who were self-supporting or job-seeking a year after their stroke. Self-rated health 3 months post-stroke and stroke severity were found to be strongly associated with RTW and subsequent work-stability after stroke.
ACKNOWLEDGEMENTS
This research was supported by The Health Foundation and Trygfonden and a 2/3 fellowship from the Faculty of Health, Aarhus University, Aarhus, Denmark.
REFERENCES

